NATGAS: Bulls Will Push Higher
The recent price action on the NATGAS pair was keeping me on the fence, however, my bias is slowly but surely changing into the bullish one and I think we will see the price go up.
❤️ Please, support our work with like & comment! ❤️
Natgas

NATGAS Will Go UP! Buy!
Hello,Traders!
NATGAS is trading in an
Uptrend and and will
Soon retest the rising
Support from where
I think we will see
A local bullish rebound
Buy!
Like, comment and subscribe to help us grow!
Check out other forecasts below too!

Natural Gas NatGas GOLD DXY Silver OIL Price Forecast00:00 Natural Gas stock Bulls NatGas Support & Resistance Guide
05:33 AMEX:UNG Stock Forecast
07:08 USO Oil Stock Forecast
09:37 Gold XAUUSD Stock Forecast
11:00 DXY US dollar Stock Forecast
13:05 Silver XAGUSD

Natural Gas GOLD DXY SILVER Oil Price Forecast00:00 Natural Gas stock Bulls NatGas Support & Resistance Guide
05:28 AMEX:UNG Stock Forecast
07:44 USO Oil Stock Forecast
09:43 Gold XAUUSD Stock Forecast
11:00 DXY US dollar Stock Forecast
12:31 Silver XAGUSD


Potential Downtrend NATGAS
The natural gas market is currently experiencing a significant downtrend. As per technical indicators including Fibonacci retracements, Ichimoku cloud analysis, volume trends, MACD (Moving Average Convergence Divergence), and RSI (Relative Strength Index), the price of natural gas has declined notably.
Current levels indicate a potential sell opportunity with a suggested stop-loss (SL) set at 2.955 and a take-profit (TP) target at 2.730.

NATTY 15% Correction on the way?Natural Gas has recorded a negative bearish divergence on the 4hr which I believe is the sign of a correction to retest the green base below.
It had fired on all of it's cylinders yesterday which I believe was a dead cat bounce removing as many short sellers as possible.
Shorting this time of year usually means commission from your broker - mine is offering 3% of my total investment.

Natural Gas DXY GOLD SILVER OIL Price Forecast00:00 Natural Gas stock Bulls NatGas Support & Resistance Guide
04:18 AMEX:UNG Stock Forecast
05:18 USO Oil Stock Forecast
06:48 Gold XAUUSD Stock Forecast
08:13 DXY US dollar Stock Forecast
10:03 Silver XAGUSD

NATURAL GAS - NatGas - LongPotential ABC could be ongoing..
open a long position only after 2,8 break

NATURAL GAS - NatGas - LongRetest of 0,61 unitl leg 1
double bottom above support area -- false break out with recovery of price livel
.. potential upside for the next move.

NATURAL GAS - NatGas - Longaccumulation of new position
I have three position long .. this is the last for a potential C

Natural Gas DXY GOLD SILVER OIL Price Forecast00:00 Natural Gas stock Bulls NatGas Support & Resistance Guide
07:51 AMEX:UNG Stock Forecast
10:24 USO Oil Stock Forecast
13:33 Gold XAUUSD Stock Forecast
15:50 DXY US dollar Stock Forecast
18:20 Silver XAGUSD

NATGAS will it continue down?Natgas is holding below the support (range), if it is able to get back, it will be able to make a retracement to 0.5 fib. Otherwise, if it is still rejected and the price closes under. Natgas will continue on 3d.

Natural Gas - Daily - Update Natural Gas - Daily - Update
These are my keylevels for Natural Gas on daily time frame
TELL long opportunity*revised trade entry for my last post on TELL:
Price finally hit the bottom of the wedge which I'm sure many other TELL traders were waiting for.
The thing is though, that the macro story for the core of their business has never been better as demand for natural gas and LNG transfer will only increase as geopolitical tension rises in the Middle East and Russia continues their offensive, all while Biden admin is on track to completely deplete the SPR for the sake of keeping US oil prices stable.
TELL has a huge opportunity to explode here...
Though, they are yet to find a partner to secure FID in the amount of I believe $14.5b for their Driftwood LNG plant in Louisiana. The longer they continue construction without this decision being made, the higher their bankruptcy risk becomes. As soon as they get it, however, investors will pile in money and the impact on price will be monstrous.
Positive developments in FID situation should bring us to dashed line.
Securing of FID could break the uptrend, in an overly optimistic case, and likely over a 1-2 year timeframe.
Personally am waiting for Monday open before I make any entry -- **If price breaks below bottom trendline, I would be very hesitant about entering a long until a reclaim.**
Please let me know your thoughts below.

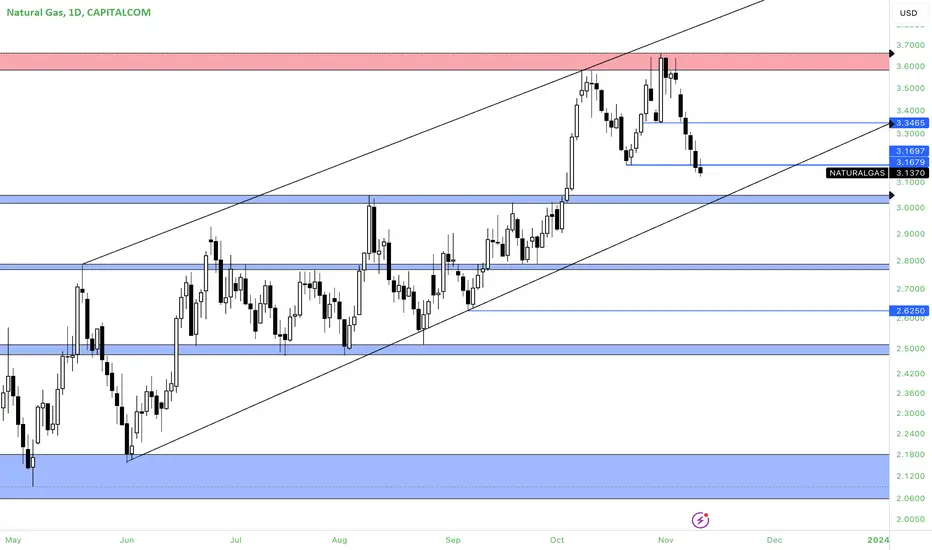
NATURAL GAS: Rebound expected near the 1D MA50.Natural Gas is on a six day bearish streak, turning neutral on the 1D technical outlook (RSI = 47.415, MACD = 0.105, ADX = 27.914). The pattern since April is a Bullish Megaphone and every pullback like this, has been a buy opportunity. The last one reversed just before it hit the 1D MA50, and as the 1D RSI is also near the S1 level, we turn bullish, targeting the R1 level (TP = 3.645).
## If you like our free content follow our profile to get more daily ideas. ##
## Comments and likes are greatly appreciated. ##

Oil - Bulls Will Be Totally AnnihilatedIn early September, we made what turned out to be a pretty accurate call on crude, predicting that $95~ was the target.
CL WTI Crude Oil - Getting In Sync With The Market Makers
In July, after analysis, I predicted that the target for crude in the intermediate term is actually a 3-or-4 handle, based on reading the tea leaves of yearly bars.
Oil - A New Long Leg Down Soon Begins
There's all sorts of fundamental reasons, one will say, that mean there's NO WAY oil should go down, so much! It should go up, because reasons!
And I think that is true. I think we're going to see $150 or $200 crude in a future that isn't very far away.
But before that happens, since oil has failed to continue upward momentum, the entire previous range from the Russia-Ukraine War has been traded, and the year has mostly been flat-red, it seems to me pretty obvious that the MMs are going to be MMs and go dumpster some long-term longs.
Which means we have a target of $56 before the end of 2024, based on monthly candles:
It's only that I think $56 won't be "the bottom," they'll drive it lowerer for longerer and make energy bulls and equities bears hate their life, before the real fun starts, because that's how big accumulation happens.
Super high prices is almost always preceded by super deep selling. Producers get net short.
Before they get net short, it takes some time to get net long, and even though you may not see that in Commitment of Traders, the big oil companies have entire floors of their headquarter buildings devoted to trading, a lot like a bank.
The Black Swan of Black Swans, though, that can spoil everyone's fun plans, is the Chinese Communist Party and Xi Jinping's tenuous grip on power and reality.
I've said in virtually every post that the CCP is going to fall in our lifetimes. It can fall in one of two ways:
1. Xi Jinping goes Gorbachev and throws the evil Party away, saving China and himself
2. Xi Jinping is strung up as the head of the evil Party, goes down to Hell with the CCP, and something else replaces it
What's at stake for Xi is not only the CCP's boundless crimes against humanity and the ruination of China's 5,000 year Heavenly Dynasties, but the eternal sin of the 24-year organ harvesting and genocide against Falun Dafa's 100 million students.
Although that persecution was started in 1999 by former Chairman Jiang Zemin, who died, because Xi is the leader of the CCP, he'll inherit the crime and face the same Sepulcher, unless he can throw the regime away like the man he ought to be.
When the CCP finally falls, whether it's because Wuhan Pneumonia dropped more than former Premier Li Keqiang, or because Xi dumpsters the Jiang Faction and the International Q Cult that's made itself a particle of the Red Dragon, everything is going to be bigly gap down on a Monday morning.
Stuff like the price of oil may seriously moon, however, because the world society's electricity, heat, and transportation relies entirely on fossil fuels.
And so all dumps on commodities may sharply truncate and reverse seemingly without cause, all equities rallies may sharply truncate and reverse seemingly without cause, and so the risk is enormous.
Trading in these markets in the next 6 months is going to be like playing with fire or gambling your fingers near a really sharp knife.
Never forget this point: a knife just cuts.
A knife doesn't care who or what it cuts. It just cuts.
If you don't want to lose your fingers and your hands, don't put your fingers and your hands under a knife.
Once they're gone, there are no miracles to bring them back.
The way it's looked at up high is that, in reality, you made the choice to put your hands under the knife, and so when it cuts what should be cut, it cut what should be cut, and that's your own problem caused by your own pursuits.
Be careful.

Natural Gas OIL GOLD DXY Silver Price Forecast00:00 Natural Gas stock Bulls NatGas Support & Resistance Guide
03:50 AMEX:UNG Stock Forecast
06:04 USO Oil Stock Forecast
08:00 Gold XAUUSD Stock Forecast
09:46 DXY US dollar Stock Forecast
11:56 Silver XAGUSD
#naturalgas #xauusd #dxy #xagusd #natgas #naturalgastechnicalanalysis #technicalanalysis #tradingstrategy #daytrading #naturalgasanalysis #naturalgastrading #natgasanalysis #uso #crudeoil

Natural Gas - Keylevels - DailyNatural Gas remains in a downward trend, we are getting closer to winter, and demand will increase.
Why doesn't the price increase more?
Or...why doesn't the price increase according to your expectations?
Simple..
The story of the war has calmed down and the FUD on prices has decreased and in addition to that, the main factor is that in several countries in EUROPE, the price of gas is capped, so that regardless of demand and supply, the price on the bill remains the same .
My opinion is that if this winter we see Natural Gas between 4-6 dollars, it would be advisable to mark our profits and wait for next year.

Natural Gas OIL GOLD DXY Silver Price Forecast00:00 Natural Gas stock Bulls NatGas Support & Resistance Guide
05:15 AMEX:UNG Stock Forecast
06:42 USO Oil Stock Forecast
09:00 Gold XAUUSD Stock Forecast
11:11 US dollar DXY Stock Forecast
13:26 Silver XAGUSD

✅NATGAS MASSIVE SWING LONG OPPORTUNITY🚀
✅NATGAS was trading around the
Bottom of the range and it
Broke out of the triangle
Pattern went up and is now
About to retest the demand
Levels below from where
I think we will see a
Strong swing move up
LONG🚀
✅Like and subscribe to never miss a new idea!✅

Natural Gas - Big moves aheadNATGAS has been putting in consecutive higher highs for the better part of a month. This is indicative of a further move up as called over a month ago. Until this trend is broken we remain bullish and are looking to break the first resistance which should then lead us to 3.5$ very quickly.
BULLISH

Reviews on NATGASJust a review on NATGAS and the direction I would want to see it pull towards.
Disclamer: Poor audio quality.
