NATGAS: What goes up must come downLets keep it simple:
We've got a complete cycle hitting 4.236 fib + fake high missing local 1.13 fib + markets in panic
We had a small H&S pointing to T1: Hit
Whats next?
Expecting a bounce after hitting 0.5 fib @ 7.69 possibly forming a bigger H&S
Hitting 0.5 again after the bounce will trigger the bigger H&S and will quickly lead to 0.618-0.886 ($7.12-$5.86) levels to be tested.
Most likely liquidity below $5.30 will be swept before making any significant upmove
Fall below 1.886 ($4.50) will lead to tests of 1.272 ($4.04) or 1.618 ($2.40)
Only a sustainable (!) breakout above the recent high will turn the situation in favor for the bulls
Hold my beer pls
----
No financial advice, do your own research, don't be stupid
Natgas

NATURAL GAS Possible analysisThe NATURAL GAS trend is bearish for the last couple of months. The market placed a 1.9625 low on 14-Apr-2023. In a 4Hour time frame market reject the resistance area ( $2.35-2.42 ) as mentioned in the price chart and continued the bearish move. Now price is traded near the Support area ( $2.15-2.10 ).RSI ( relative strength index ) at over-sold levels and Volume indicates bears lose momentum. Price respected the trendline in the past two times and is now again near to test, so if the market close above this trendline with a strong bullish candle stick pattern then probably the market going up. So initiate long positions after closing above the Support area and also the trendline. On the other side, the Price traded below 200 MA (moving average ) which indicates the bearish trend is still in line. So Short selling is favorable if the price breaks the trendline to the downside and close below the support area as mentioned in the price chart after confirmation by a bearish price action structure.
Support and Resistance levels for day trading ;
Pivot Point Level: PP 2.1872
Support Levels: S1 2.0987, S2 2.0416, S3 1.9531
Resistance Levels: R1 2.2443, R2 2.3328, R3 2.3899

Natural Gas Forecast | Detail Price Level Trend Guide- Natural Gas confirm its daily uptrend
- broke bullish out of the equilibrium wedge that has been chopping around for months.
- Ideally for bulls we re-test the wedge and bounce off of it
- for bears they would want it to break back into it

Nat Gas may get bubblyAfter a bottoming process and a reset of the rsi, a surge up is possible here. Nat gas is also at structural support which usually reacts with price in a positive or negative way. Holding here and not getting below 2 dollars would be very positive. If correct, the target is about $3.50

NATURAL GAS ( XNGUSD ) Long Term Trading Idea Hello Traders
In This Chart XNGUSD HOURLY Forex Forecast By World of Forex
today XNGUSD analysis 👆
🟢This Chart includes_ (XNGUSD market update)
🟢What is The Next Opportunity on NZDCHF Market
🟢how to Enter to the Valid Entry With Assurance Profit
This Video is For Trader's that Want to Improve Their Technical Analysis Skills and Their Trading By Understanding How To Analyze The Market Using Multiple Timeframes and Understanding The Bigger Picture on the Charts.

NATGAS Detail Trade Plan | Price Level S/R Guide- UNG falling wedge still intact,
- NATGAS potential daily downtrend forming we have to see if bulls can play defense and negate that bear flag.
- hourly trend will be my guide, if need bulls to form hourly uptrend before anything.

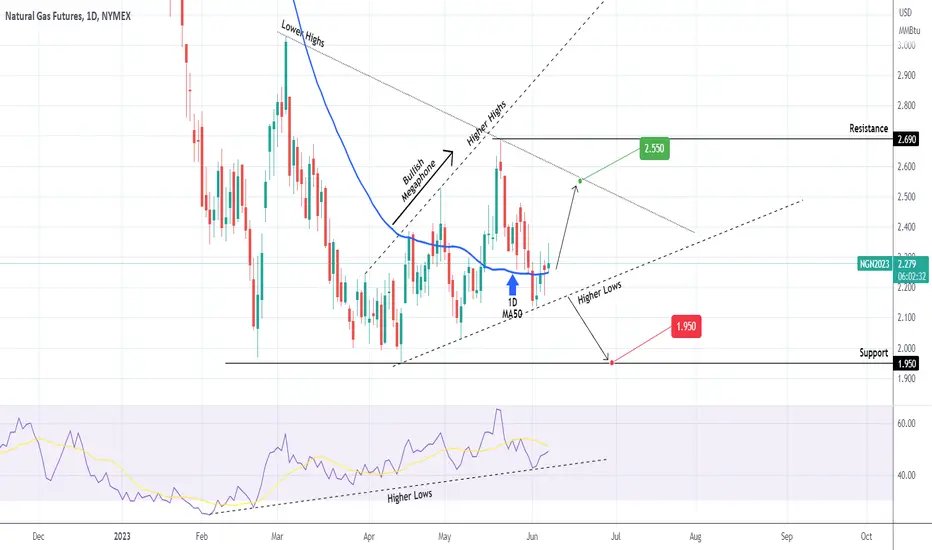
NATURAL GAS Buy signal unless this Higher Lows line breaks.Natural Gas (NG1!) is trading inside a Bullish Megaphone that has just priced its new Higher Low. The price is above the 1D MA50 (blue trend-line) and has started the new leg to a Higher High. Before that however, it has several Resistance levels to overcome, namely the 2.690 Resistance and before that the Lower Highs trend-line. As a result we are buyers but set a target below that level at 2.550. If instead the price closes a 1D candle below the bottom (Higher Lows trend-line) of the Megaphone, we will sell and target the 1.950 Support.
It is worth mentioning the 1D RSI that has been trading on Higher Lows since February 03, an early Bullish Divergence signal against the downtrend's Lower Lows for the price. This momentum continues to favor buying on the medium-term.
-------------------------------------------------------------------------------
** Please LIKE 👍, FOLLOW ✅, SHARE 🙌 and COMMENT ✍ if you enjoy this idea! Also share your ideas and charts in the comments section below! **
-------------------------------------------------------------------------------
💸💸💸💸💸💸
👇 👇 👇 👇 👇 👇
NATGAS BOIL NG Bottoming formation.Natural gas has been basing for a few months now in what has become a very recognizable Wyckoff accumulation pattern. Complete with high volume on the start to low volume towards the end. Breakouts occur on LOW VOLUME in accumulation phases so don't look for volume to give a clue. Just like the AMEX:SPY and NASDAQ:QQQ markets did at the October bottoms. Remember everyone saying how low the volume was? Yes, same here. We also see a very recognizable MEGAPHONE BOTTOM specifically on BOIL. This is regarded as a bullish signal showing that the existing downtrend may reverse to start a new UPTREND. Further, we see evidence in arcs of a possible bottom. EW counts also suggest the bottom is in for now.

NatGas UNG Detail Trade Plan With Support & Resistance Levels- UNG falling wedge still intact
- potential lacking follow through on the bears on Friday
- Natural Gas needs to confirm 1h uptrend as their very first step

NATGAS Will Keep Falling! Sell!
Hello,Traders!
NATGAS is trading in a
Downtrend and the pair
Has formed a bearish flag
Pattern so now that we are
Seeing a bearish breakout
I think that the price
Will go further down
Sell!
Like, comment and subscribe to help us grow!
Check out other forecasts below too!

✅NATGAS STRONG DOWNTREND|SHORT🔥
✅NATGAS has formed a bearish
Flag pattern while trading in a
Downtrend so IF we see a breakout
Then I think that the price
Will go further down
SHORT🔥
✅Like and subscribe to never miss a new idea!✅

UNG Perfect Falling Wedge Rejection | Support & Resistance Guide- UNG rejected from falling wedge upper resistance now dropping a little more then what bulls want to see
- need to confirm a hourly uptrend as the first step for bulls
- want to see it hold it hold 6.65 otherwise going to 6.3

$BOIL #NG Buy the dipI've been bullish and trading natural gas (BOIL EQT RRC) for a while now and recently sold on the last pump to 2.6
I'm reloading now, as I'm looking at a few things technically I like
-Price appears to have found support on a flattening 20DMA , and will next watch to see if we start trending up
- The low in May was higher than April , and almost forming a rounded base if we can sustain higher than May's low , it will be a good sign
- Strong support at 2 putting in a triple bottom now - even if we go lower, in the longer term as long as we stay above 2 , your entry of say 2.15 won't really matter when we're at 5 !
- EQT and RRC are both flagging and keeping their gains so far, looking for more upside , which of course depends on NG but is providing bullish confluence .

NATURALGAS 22May2023broadly speaking, it is sideways with a fairly large range. but we can still take a chance on a good moment. if you look at the current elliot notation, it is likely that the price will go to the previous HH, you can take a long opportunity with the SL area below the invalid area

May 21,23-NG-Will NG hit 2.7?Will NG go up this week to 2.7?? Let me know your thoughts. I'm on the fence...I think I will put my TP at 2.6 and be satisfied with that.
I have placed my Stop Loss at 2.4 (the green line) so I will only profit 100 points or so if it gets hit, but better than nada right? :-o
Let me know what you think.
Stay safe all.
Heiko

Natural Gas Psychology | In-depth Support & Resistance Guide- Natural Gas First Daily uptrend in a while, still continuing
- potential Weekly bull flag if we don't retrace over 0.382
- Next key resistance at 2.65 zone

May 18,23-NG-Finally Up Up and away?Did anyone put in a Buy Order at 2? or 2.1?
You can finally see two weeks in a row of Bullish price movement!! Finally!
You can also see price actually passed the green Alligator line which is a bullish sign - just hoping it closes tomorrow ABOVE this line. Then hopfully al good next week.
But who knows - next week is next week. AnyHOOO
Hope all is well with everyone - sorry for a lack of posts recently but there has been nothing but sideways action, until now.
Stay safe !!
Heiko

Where is NATTY going next?Huge sell of occurred after breaking it's previous support, turned resistance.
I'd be looking to buy of the resistance @ around 2.050 with the aim of it reaching the broken support.
If it finds resistance there then we might see a H&S pattern emerge which could be severely bloody.
With recession peaking over the corner, this could well play out.
Just my thoughts, not trading advice . Trade at your own risk. NATTY can be expensive .

Natural Gas Short squeeze!Natural Gas had a bullish close today up over 4% despite weakening economic data.
We could be entering the next stage where Nat gas starts moving higher off these lows.
Clear Accumulation has been occurring and this move off the lows matches the seasonality period of Nat gas.

NATURAL GAS POSSIBLE RALLYNatural gas is increasing in value due to several factors: the unprecedented wildfires in Canada that are ravaging the country and are disrupting the production throughout the province of Alberta; Reuters also reports that Russian pipeline exports had declined 11.4% this month compared to April’s average, putting an additional hold to the fuel supply.
The RSI is above 50. The MACD had broken above its zero level and had triggered signal for further potential gains.
If the current trend continues, the price might test resistance levels of 2.764, and if it gets broken, further target might be 2.931.
In the opposite scenario, the price might test its previous resistance at 2.025.
Risk Disclosure: Trading Foreign Exchange (Forex) and Contracts of Difference (CFD's) carries a high level of risk. By registering and signing up, any client affirms their understanding of their own personal accountability for all transactions performed within their account and recognizes the risks associated with trading on such markets and on such sites. Furthermore, one understands that the company carries zero influence over transactions, markets, and trading signals, therefore, cannot be held liable nor guarantee any profits or losses.

Natural Gas & Energy UpdateNatural Gas is on watch for a technical Breakout
We got a bullish daily close on Natural gas today.
Its the first time Nat gas has had 2 daily closes above the 50 day moving average since it started the nasty downtrend.

Natgas very stretched to the downsideHow far are we away from monthly:
SMA 36
Mom 12
It looks like might really be ready for bounce - catching the falling knive?

Ng1! bounce ahead?No clear bottom just yet. MacD on the monthly and Stoch RSI are not giving any signals.
The Moving averages are also still trying to catch up to the downside.
