✅NATGAS POTENTIAL SHORT🔥
✅NATGAS will soon retest
The falling resistance of the
Narrowing wedge from where
I think it will fall down
Towards the rising trendline below
SHORT🔥
✅Like and subscribe to never miss a new idea!✅
Natgas

#NaturalGas Can Rise Up Very Quickly #NATGASTraders, Natural gas has created several bullish breakouts over the past weeks but failed to push higher. Now as we are reaching the end of the wedge pattern, a breakout is imminent. This can create a W pattern which in turn can push the prices higher.
Please support this analysis by liking and sharing. 👍🙂
Rules:
1. Never trade too much
2. Never trade without a confirmation
3. Never rely on signals, do your own analysis and research too
✅ If you found this idea useful, hit the like button, subscribe and share it in other trading forums.
✅ Follow me for future ideas, trade setups, and updates on this analysis
✅ Don't hesitate to share your ideas, comments, opinions, and questions.
Take care and trade well
-Vik
____________________________________________________
📌 DISCLAIMER
The content of this analysis is subject to change at any time without notice and is provided for the sole purpose of education only.
Not financial advice or signal. Please make your own independent investment decisions.
____________________________________________________

Natural Gas Clear Support & Resistance Guide | Falling Wedge- AMEX:UNG AMEX:BOIL PEPPERSTONE:NATGAS Natural Gas clear falling Wedge
- Daily uptrend confirmed without much follow through at the moment
- bulls would like us to hold prior pivot lows and bonce off next week

NATGAS Trading Opportunity! SELL!
My dear subscribers ,
This is my opinion on the NATGAS next move:
The instrument tests an important psychological level 2.348
Bias - Bearish
Technical Indicators: Both Super Trend & Pivot HL indicate a highly probable Bearish continuation.
Goal - 2.202
About Used Indicators:
The average true range ATR plays an important role in 'Supertrend' as the indicator uses ATR to calculate its value. The ATR indicator signals the degree of price volatility.
———————————
WISH YOU ALL LUCK

NATGAS: Short Signal Explained
NATGAS
- Classic bearish pattern
- Our team expects retracement
SUGGESTED TRADE:
Swing Trade
Sell NATGAS
Entry Point - 2.347
Stop Loss - 2.509
Take Profit - 2.104
Our Risk - 1%
❤️ Please, support our work with like & comment! ❤️

NATGAS Bearish Bias! Sell!
Hello,Traders!
NATGAS is trading in a
Narrowing wedge which
But the long-term bias
Is bearish so as the price
Is about to retest the
Falling resistance of the
Wedge I think that we will
See a move down
To retest the rising support
Sell!
Like, comment and subscribe to help us grow!
Check out other forecasts below too!

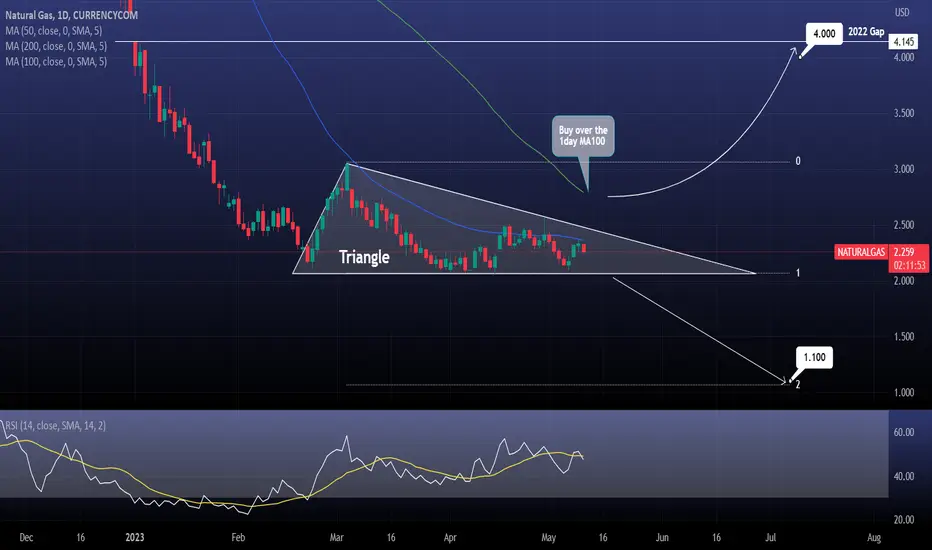
NATURAL GAS The Triangle's breakout will determine the trendNatural Gas is trading inside a Triangle, with the 1day MA50 as the Resistance.
The critical level is the 1day MA100. If the price breaks above it, target the gap from 2022 at 4.000.
If the price crosses under the Triangle's bottom, target Fibonacci 2.0 at 1.100.
Follow us, like the idea and leave a comment below!!
NATGAS, Accumulation mode is definitely ON before x4 by DecemberNATGAS weekly data is conveying massive accumulation at the current price range of 2.0 to 2.2.
Target by Winter/December will be a 6.0-8.0 price range.
TAYOR.

Natgas: More pressure! 💪You know this one?
Pascal: “Hurry up! Get a move on! We really need to get going!”
- “Whoa, that’s a lot of pressure for just one Pascal…!”
Okay okay, bad jokes aside, Natgas does need a bit more pressure to rise from the compound consisting of the white zone between $1.880 and $3.436, the blue zone between $2.407 and $3.277 and the pink zone between $2.573 and $3.439. Above this conglomerate, it should finish wave iv in pink before turning downwards to develop wave 2 in green, which should then lead below the bottom of the white zone. Once this prominent low is established, Natgas should take off again. However, there is a 40% chance that Natgas could leave the white zone on the southern side, thus expanding wave alt.2 in green earlier already.

NATGAS The Target Is UP! BUY!
My dear subscribers ,
This is my opinion on the NATGAS next move:
The asset is approaching an important pivot point 2.162
Bias - Bullish
Technical Indicators: Supper Trend generates a clear long signal while Pivot Point HL is currently determining the overall Bullish trend of the market.
Goal - 2.268
About Used Indicators:
By the very nature of the supertrend indicator, it offers firm support and resistance levels for traders to enter and exit trades. Additionally, it also provides signals for setting stop losses
———————————
WISH YOU ALL LUCK

NATGAS: Long Trade with Entry/SL/TP
NATGAS
- Classic bullish pattern
- Our team expects pullback
SUGGESTED TRADE:
Swing Trade
Buy NATGAS
Entry Level - 1.997
Stop Loss - 1.839
Take - 2.234
Our Risk - 1%
❤️ Please, support our work with like & comment! ❤️

NATGAS Will Go UP! Buy!
Hello,Traders!
NATGAS is nearby the
Horizontal support of 2.00$
So despite the downtrend
I think that a good rebound
Is possible on GAS
Buy!
Like, comment and subscribe to help us grow!
Check out other forecasts below too!

Natural Gas Support and Resistance Guide | Price Outlook- AMEX:UNG AMEX:BOIL VANTAGE:NG Still trading within my falling wedge pattern is getting tight so likely breaking soon
- Bounced off of quadrupole support Friday
- couple of resistance level right above us may test the upper falling wedge resistance next week

✅NATGAS GROWTH AHEAD|LONG🚀
✅NATGAS has retested a key support level of 2.00$
And as the pair is already making a bullish rebound
A move up to retest the supply level above at 2.28$ is likely
LONG🚀
✅Like and subscribe to never miss a new idea!✅

NATURAL GAS: Hit the 2 month Support. Buying is favored.Natural Gas hit the S1 Zone today (2.100 - 2.060), which started forming on February 22nd. This support has held another 8 times and with the 1D time frame neutral technically (RSI = 45.392, MACD = -0.046, ADX = 18.986), we are making a buy call targeting the 0.382 (TP = 2.440). In addition, the 1D RSI is bouncing off the HL trendline.
In the event however that the 1D candle closes under 2.060, we will revert to selling and target the -0.236 Fibonacci level (TP = 1.830).
## If you like our free content follow our profile to get more daily ideas. ##
## Comments and likes are greatly appreciated. ##

NG - Serious Bear - ST/LT View This is a serious bear... I am giving my short term/long term outlook here.
Setting up for near term buy. Longer term I believe there will be another low coming. A wave 3 low is currently setting up with a long side wave 4 counter trend trade opportunity.
Here is a Monthly Linear Chart with my anticipated pathway and target price for a longer term buy.

Long on NATGAS throughout the month of AprilSeasonally, April is on average a bullish month for Natural Gas and looks to have set up for a similar outcome this year.
It has made a huge double bottom on the daily with a extreme bullish RSI divergence and you can see a similar positive RSI set up on the hourly and the 4 hour chart as presented in my post.
My target is modest 3 which would is the most recent resistance tested on the 3rd of March and a increase of 46%.
Good luck!

Natural Gas Weekly Price Outlook | Support & Resistance Guide |- Natural Gas falling wedge is my support and resistance guide
- Currently Daily & 4h Neutral trend
- 2 key support below and 2 key resistances above.

BULL FLAG! (4HR / 8HR)Natural Gas forming a BULL FLAG with a nice bounce off new support. Near term bullish.

NATGAS, keeps the flame burning. Upside continues.NATGAS weekly data is suggesting firm price foundation at current levels and an upside continuation is inevitable.
SPOTTED at 2.4 (continuation from 2.0 levels)
_______________
Related news:
Nat-Gas Prices Rebound on Outlook for Cold U.S. Temps
www.tradingview.com
BOIL: Boiling up and down 🥘Still a bit tentatively but visibly, ProShares Bloomberg Natural Gas (aka BOIL) is starting to boil up, quite in accordance with our expectations. As the first part of a three-part counter movement, the ETF should climb further upwards to finish wave a in magenta, before wave b in magenta should return it to its current level. From there, BOIL should rise into the yellow zone between $7.11 and $19.05 to complete wave c in magenta as well as wave (4) in yellow, whose high should then initiate the overarching downwards trend’s final step: wave (II) in white.

Natural Gas Detail Trading Plan |Long term| Support & Resistance- AMEX:NG AMEX:UNG AMEX:BOIL : if i were to add today, I laid out a detailed game plan in the video of how to trade it with SL and target.
- 4 hour currently in neutral trend
- potentially shaping up daily higher low and trend change to uptrend need to break above prior high
- still trading within the equilibrium range likely breaking in early May

Natgas 4h flip a coin. Market is Always right. Hopefully WE will have some move today. We may see another selling impulse and another bottom or break lower for the coming hours or days. As Always natgas Can make us +12% -12% in a single day even for no Real reasons sometimes ..so i will advise cautious, observe and stay tune or open position with tigh SL.
