✅NATGAS BUYING OPPORTUNITY|LONG🚀
✅NATGAS will soon retest a key support level of 2.2$
So I think that the pair will make a rebound
And go up to retest the supply level above at 2.28
LONG🚀
✅Like and subscribe to never miss a new idea!✅
Natgas

NG, 1st spark up... flame will ascend to new highs soon..NG correction is slowly concluding -- with bears showing some weakness on weekly data, after touching the order block support at 1.9 level.
A reversal is on queue now.
Expect some signficant moves on the upside soon -- a revisit to 7.0 before year ends is possible.
SEEDED L at 2.09
TAYOR.

Natural Gas Future Outlook Weekly /Daily S&R Technical Analysis - AMEX:NG Finally got a 4 hour uptrend need more follow through tomorrow to confirm
- likely heading to $2.5 if 4 hour uptrend confirm follow through tomorrow
- tradeable ticker AMEX:UNG and AMEX:BOIL still use the NG chart if you are trading natural gas.

Apr 18,22-NG-FINALLY going up :-)So it looks like I was more or less correct - 2 was a decent bottom and good entry point.
Don't know how many of you got in, but I'm in at 2 going long so I'm in decent profits currently.
I'll keep you updated as usual. As you can see I am trading on the weekly/daily so I'm not sure what my target is yet, but I am partial to 500 point profits so I might get out if NG hits 2.5
Take care and stay safe.
Heiko

Natural Gas Weekly Bear Flag potential but still holding Support- AMEX:NG AMEX:UNG AMEX:BOIL needs that 4 hours trend change otherwise even the big moves will essentially just fade
- still a potential weekly bear flag
- but still holding bottom wedge support and also double bottom on daily.

NG, on active accumulation phase..NG, is undergoing significant accumulation at the current levels. It revisited strong order block / support at 1.9 level and it touched this multiple times. It retested it and bounce back-- only to return to it multiple times. Let's see if it can finally muster strength to reverse from this level.
Spotted at 2.10
TAYOR.
NATGAS On The Rise! BUY!
My dear subscribers ,
NATGAS looks like it will make a good move, and here are the details:
The price is coiling around a solid key level - 2.047
Bias - Bullish
Technical Indicators: Both Super Trend & Pivot HL indicate a highly probable Bullish continuation.
Goal - 2.206
Recommended Stop Loss - 1.960
About Used Indicators:
A super-trend indicator is plotted on either above or below the closing price to signal a buy or sell. The indicator changes color, based on whether or not you should be buying. If the super-trend indicator moves below the closing price, the indicator turns green, and it signals an entry point or points to buy.
———————————
WISH YOU ALL LUCK

NATGAS long(!)Strong long from current market levels and 1.98 if goes down.
Please keep R&MM if trading.
Good luck.

natgas - target 1,8Similar pattern.
Short view for the end of this week. I am waiting for 1,8 to buy natgas again.

NATGAS Risky Long! Buy!
Hello,Traders!
NATGAS went down again
And is retesting the horizontal
Support level of 2.00$ again
So while the bias is somewhat
Bearish I think that due to the
Strength of the level we can
Count on one more rebound
Buy!
Like, comment and subscribe to help us grow!
Check out other forecasts below too!


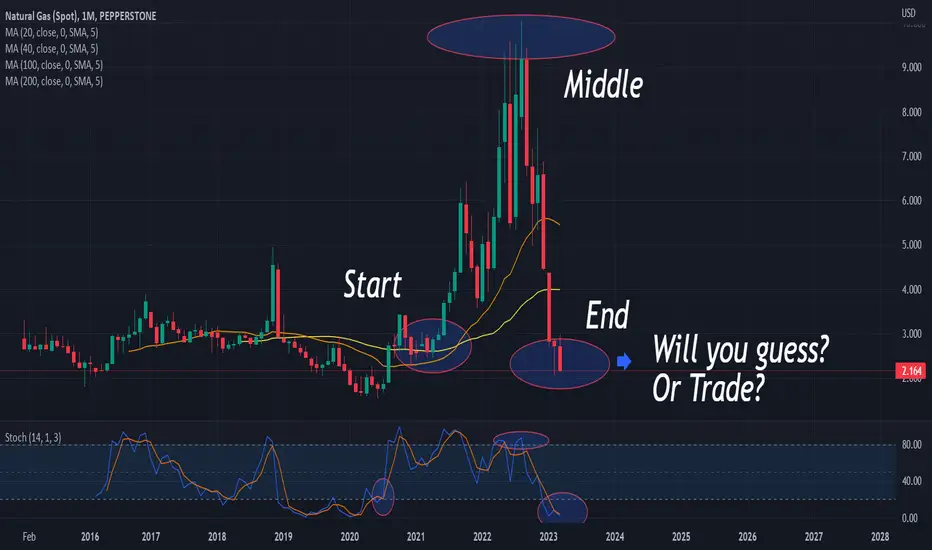
Understanding NATGAS MarketsHey Traders,
Loads of traders keep asking me privately and on my streams about this asset.
The reason why people are interested in it is purely because they want the thrill and the chase. You can see the start of the enormous explosion came because of news sentiment and shortages of gas due to the ongoing war. That means the price goes up due to demand and diminished supply. However, naturally, with any market that ends and you get an enormous fall much like you saw with the USDJPY and other assets like gold.
After large moves up comes large moves down. And in future, again, large moves up. But the question of 'When' is what makes people excited. If you are Trading due to excitement, stop. It will crush you.
You need to take logical decision based on the value of the asset and continuous gains. If you are trying to buy so you can catch an ultimate rise despite market sentiment you are trading for excitement, because you don't know when sentiment will be extreme enough to get sufficient gains on a move up. The price, technically, is low like it was before and somewhat constitutes only light entries to the long side with early exits based on previous minor PA.
But do not trade this for a 'big win'. Trade assets with tonnes of price data that is concrete. Mostly NATGAS flies when there is some sort of crisis which are not all too frequent (see 2000, 2008).
Trade safe and Trade small. Do not load in there is STILL a chance you can go further.
Natural Gas Long Term Outlook | Importance of 4H Trend change | - AMEX:NG AMEX:UNG AMEX:BOIL cant stress enough we need to change trends, even if it is a very big move it will just fade if no trends are changed
- need to change the 4h and daily trend to the bulls
- likely tightening up in a equilibrium into May, still holding the teal support line.

WTI Crude - Step 1) $88 --> Step 2) $58.When it comes to oil, it was supposed to do the super moon back to $120 thing when Xi Jinping and his Chinese Communist Party finally stopped welding people in their homes and going full blown technocratic social credit while humans tried to "fight" Wuhan Pneumonia (COVID-19), but for one reason or another, the pump never got off the ground.
Probably because a whole lot more than the 87,468 people Xi and his CCP claim to have died from the disease are actually dead, and so demand is just legit in the toilet and industry can't get going, because China has big time problems stemming from its 23-year-long persecution of Falun Gong, which includes the unprecedented crime of live organ harvesting (they've done it to Uyghurs too), and the Party's outright fetish for human rights, freedom of speech, and freedom of belief abuses.
Being bullish on "China" is a totally separate thing from being bullish on "the Chinese Communist Party." One is extremely wise, while the other is totally moronic.
Totalitarian regimes never last a long time, and the Party has already had more than a century. Clinging to Marxism is like clinging to the Titanic when it's 5/6ths of the way under the water.
When it comes to WTI oil, both the fundamentals and the price action are strange. This is a commodity that you don't want to be very bearish on after it traded at literally $0 during 2020's western COVID pseudopandemic theatre hysterics. Yet, while oil also isn't liking to go down, it isn't liking to go up.
In October, I had a pretty accurate call that WTI would plink the $70 range.
WTI Crude Oil / CL1 - Accumulation Before Global Conflict
And a pretty good call in September too when everyone was convinced oil could never trade low again
WTI Crude / CL - An Intervention: Saving Blind Bulls
But the ultimate endgame of the calls, $50, has not manifested. It seems as if perhaps these prices won't manifest, and it's almost time for the uppy.
There's some problems with this narrative, however.
The key factor is that the United States and its vassal states (including Canada) are the world's largest producers of oil, by far. Russia and OPEC combined are really the only challengers, but the US has the advantage in that you need the USD to buy oil, and so ultimately the Biden Administration is the legit market maker.
The problem with the bull thesis is that the SPR was filled at $29.70 over the years while Biden and friends sold half of it off in the $80s and $90s. This inherently tells you not that they're trying to destroy themselves, but just that they're short on crude oil.
The news in December, right after oil wicked the $70 mark, was that the Biden Admin was buying it all back .
But then in January, the tune changed as the US Government said "The bids didn't come in low enough, so we haven't bought yet." Media says they want to buy around $70.
And this brings us to our very strange price action in WTI.
Crude has a gap at $85-86 and combines with a Dec. 1 pivot around $83, while recent trading activity was a triple top of successive lows at $82~.
Then we dumped to $72, but did not make a new low, and have since bounced back to $80.
All of this combines to give us no reason to believe that a hybrid short-killer/breakout trader-crusher play is not about to be made around the $88 level.
This gives us 10% to the upside, which is really quite nice to work with when WTI trades 1,000 barrel lots and you also have access to the leveraged ETFs like UCO and SCO.
But the bottom is not in. Look at the weekly candles.
Oil just hasn't retested the long-term trendline from late 2021, and in combination with the US Government having been unwilling to refill the SPR at $75+, should give you all the reason in the world to be extra cautious with going long as more than a scalp.
Under $60 **combining** with media chatter that Democrats are refilling the SPR is where you want to go long. And if you do it right, you'll get the bottom for what will quickly turn into $180.
2023 is going to be a wild year starting in July. If humanity makes it to 2024, it will be even more of a ride.
TL;DR: Long to $88 --> Short to $55, and start treating Bloomberg's Javier Blass like Jim Cramer. Trade against the narrative. Be patient. It's too early for the next moon, yet $120 in '22 was no top.
This should combine with natural gas being on the cusp of pumping:
Natural Gas? More Like Natural Go. 4-Handle Coming
Be careful, and trade safe.

✅NATGAS WAIT FOR BREAKOUT FROM THE RANGE|LONG🚀
✅NATGAS was trading in a
Downtrend but then the pair hit
The support level of 2$ and
Formed a parallel range
So IF we see a bullish
Breakout from the range
I think we will see further growth
LONG🚀
✅Like and subscribe to never miss a new idea!✅

NatGas LongNaturalGas strong bullish signal on H4 chart. There was a consolidation 2.10-2.25 levels, according the last move 2.25 level become a new support zone and this is quite a strong signal to buy...

Apr 10,23-NG-Finally hit bottom?Some decent gains today...Finally!! So have we finally hit a bottom? Back in Mid to late Feb price bounced off the 2 mark...so it looks like 2 is a very strong bottom. Or are we just going to go sideways now for a while? No bloody idea!
But at least we have some gains today...could be a good week...or could just be sideways week - keep your eye on it.
Lots of financial activity this week from the Fed etc so markets could change instantly.
Trade safe and stay safe!
Heiko

NAT GAS LONG. The lows are LIKELY in for Nat GasNat Gas is probably THE most hated commodity now. Its reached MAJOR Horizontal Support, and 2 CONVERGING Trendline supports. ALL 3 are Converging at $2 level. Expect a bounce to 1st Target at recent highs $3 with Ultimate Target price at upper end of falling trend channel ~$3.55. Historical average Price of Nat Gas is $4 since 1990 with $1.62 - $2.00 range acting as MAJOR Support Zone for the last 35 YEARS.
Current price is also at the BOTTOM of the recent trading range and price appears to be forming a Wyckoff ACCUMULATION.
LONG Nat Gas at $2.01 and anything <$2.01. SL = CLOSING PRICE < $1.44. Reward:Risk = 1.75:1 at $3.00 target price and 2.7:1 at $3.55 Target Price
Trade what you see.

NATGAS, Where I expect the low to be printed. NATGAS / 4H
Hello traders, welcome back to another market breakdown.
NATGAS has been trading in a down trend, the price is extremly oversold. I'll be looking for a short squeeze setup once it get to my level.
Tarde safely,
Trader Leo.

natgas - last bounce before 1,6-1,8Natgas should continue bearish trend, bull pressure is temporary. I will start selling from 2,25-2,4 ( SL above 2,5 and TP 1,6).

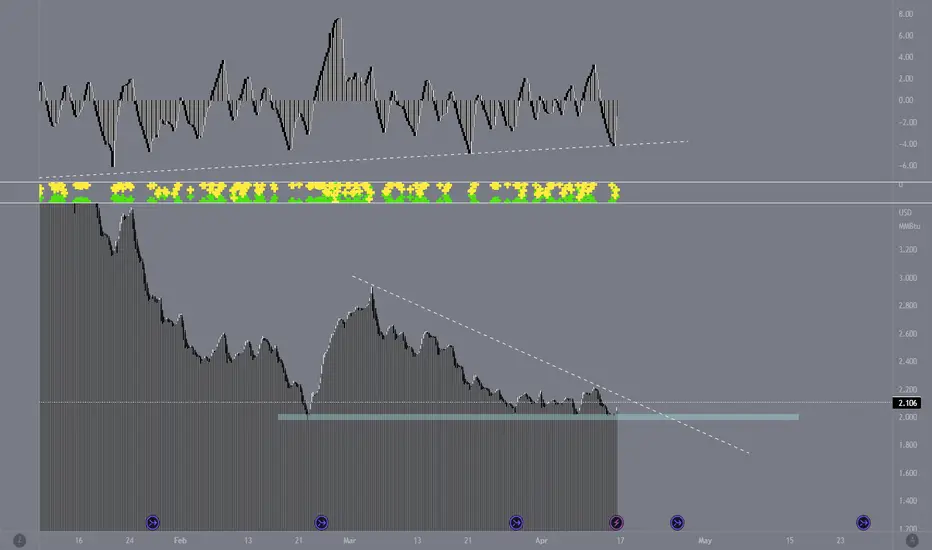
Natural Gas: Commodity DivergencesThe correlation between DBC (orange line) and Nat Gas is strong.
However, Nat Gas gas does have price history where it diverges, leads & lags the average DBC price action. The white arrows on the screen display the periods where Nat Gas And DBC (in orange) diverge. Some of the divergences have lead to steep pops & drops of mean reversion.
What were seeing now is a massive divergence of about -33%, Nat gas has crashed and is the number one underperforming commodity in this basket.
Nat gas has retraced back to the Pre Covid low levels. Looking at the DBC ETF its about 33% off the Pre Covid Lows.
Over history the correlation usually tightens up and it has a long way to go to close the gap divergence. This presents one of 3 scenarios..
1. Other commodities in the basket collapse
2. Natural Gas Rallies
3. Both options (Our Base Case)

BOIL hitting a major line of resistance For the 4th time since 2012 BOIL has hit the bottom of this descending channel. The fib extension landed perfectly on the 1 (3.31) and the stoch RSI (monthly) is showing oversold. A short-term move up to the first and/or second brown line has been the historical bounce, eventually making it to the third brown line before falling again. So lets see if it reacts the same way or if it finally busts below this blue trendline.

Natural Gas (NATGASUSD): How to Buy With Confirmation 💨
Multiple time frame analysis on Natural Gas.
Detailed trading plan.
Potential scenarios.
❤️Please, support this video with like and comment!❤️
