NATGAS: Long Trade Explained
NATGAS
- Classic bullish pattern
- Our team expects retracement
SUGGESTED TRADE:
Swing Trade
Buy NATGAS
Entry - 3.325
Stop - 3.206
Take - 3.559
Our Risk - 1%
Start protection of your profits from lower levels
Disclosure: I am part of Trade Nation's Influencer program and receive a monthly fee for using their TradingView charts in my analysis.
❤️ Please, support our work with like & comment! ❤️
Natgas

NATGAS Will Collapse! SELL!
My dear friends,
My technical analysis for NATGAS is below:
The market is trading on 3.787 pivot level.
Bias - Bearish
Technical Indicators: Both Super Trend & Pivot HL indicate a highly probable Bearish continuation.
Target - 3.487
Recommended Stop Loss - 3.956
About Used Indicators:
A pivot point is a technical analysis indicator, or calculations, used to determine the overall trend of the market over different time frames.
Disclosure: I am part of Trade Nation's Influencer program and receive a monthly fee for using their TradingView charts in my analysis.
———————————
WISH YOU ALL LUCK

$UNG starting to accumulate a position. Swing TradeBuilding a position in unleveraged natural gas AMEX:UNG in $13-14's
Divergence on price/RSI.
Falling Wedge
Would like to see price get over and hold above daily 50MA
Will likely update once that is achieved
After 50MA is achieved and held, breakout the wedge and target the 200MA daily for profit.
Add on down days and be very patient with this one

Natural Gas | Oil | Dollar | Silver | Gold Price ForecastNatural Gas NYMEX:NG1! | Oil | Dollar | Silver | Gold Price Forecast
OANDA:XAUUSD NYMEX:CL1!

NATGAS: Short Signal with Entry/SL/TP
NATGAS
- Classic bearish pattern
- Our team expects retracement
SUGGESTED TRADE:
Swing Trade
Sell NATGAS
Entry - 3.787
Stop - 3.900
Take - 3.557
Our Risk - 1%
Start protection of your profits from lower levels
Disclosure: I am part of Trade Nation's Influencer program and receive a monthly fee for using their TradingView charts in my analysis.
❤️ Please, support our work with like & comment! ❤️

NATURAL GAS Massive 1W MA50 rebound eyes $6.800Natural Gas (NG1!) is on 3 week bullish streak following the rebound on its 1W MA50 (blue trend-line), which came straight after a 1W MA50/100 Bullish Cross. This rebound manages to keep the long-term Channel Up valid and this rebound is technically the start of it new Bullish Leg.
This price action is similar to the previous 1W MA50/100 Bullish Cross, which also took place inside a Channel Up. As you can see the 1W RSI fractals among the two sequences are identical and the past one rose by +167.17% from that 1W MA50 bottom to the 2.5 Fibonacci extension.
If this time it 'only' hits the 2.5 Fib ext, then we are looking at a $6.800 Target around the end of the year.
-------------------------------------------------------------------------------
** Please LIKE 👍, FOLLOW ✅, SHARE 🙌 and COMMENT ✍ if you enjoy this idea! Also share your ideas and charts in the comments section below! This is best way to keep it relevant, support us, keep the content here free and allow the idea to reach as many people as possible. **
-------------------------------------------------------------------------------
💸💸💸💸💸💸
👇 👇 👇 👇 👇 👇

Natural Gas Slowed Down For A Correction Within UptrendEU Commission will propose in June banning Russian gas and LNG imports under new deals and existing spot contracts by end-2025.
Natural gas slowed down recently, but despite that retracement, we see it as an ABC correction after a potential leading diagonal formation from the lows. It actually stopped perfectly at the former wave 2 swing low and 61,8% Fibonacci support area, from where we may now see a bullish continuation, especially if it recovers back above 4.15 bullish confirmation level.

NATAGAS - RSI Divergence - ShortNATAGAS - RSI Divergence - Short
Potential opportunity for this trade

NATGAS - Scalping Short - RSI DivergenceNATGAS - Scalping Short - RSI Divergence.
there is possibilities for a quickly short

Bullfinder's Breakout Commodities - Natural GasWelcome to Bullfinder's Breakout Commodities - Commodities with breakout potential.
In this edition, we'll be looking at PEPPERSTONE:NATGAS ...
Our Team has identified that this code is at a point of particular interest & potential volatility.
After re-rating Natural Gas's momentum to Bullish on the 26th of Nov 2024, our Team has again set eyes on the commodity, noting the following important reference point...
If price can hold above $2.950 ... Significant Bullish potential may be unlocked.
If however price falls below $2.950 ... Significant Bearish risk may come into play.
We're inspired to bring you the latest developments across worldwide markets, helping you look in the right place, at the right time.
Thank you for reading! Stay tuned for further updates, and we look forward to being of service along your trading & investing journey...
Disclaimer: Please note all information contained within this post and all other Bullfinder-official Tradingview content is strictly for informational purposes only and is not intended to be investment advice. Please DYOR & Consult your licensed financial advisors before acting on any information contained within this post, or any other Bullfinder-official TV content.

Natural Gas | Oil | Dollar | Silver | Gold Price ForecastPrice action, multi time frame, trend analysis on
NYMEX:NG1! PEPPERSTONE:NATGAS AMEX:UNG | Oil | Dollar | Silver | Gold Price Forecast

NATGAS Under Pressure! SELL!
My dear friends,
Please, find my technical outlook for NATGAS below:
The instrument tests an important psychological level 3.667
Bias - Bearish
Technical Indicators: Supper Trend gives a precise Bearish signal, while Pivot Point HL predicts price changes and potential reversals in the market.
Target - 3.408
Recommended Stop Loss - 3.818
About Used Indicators:
Super-trend indicator is more useful in trending markets where there are clear uptrends and downtrends in price.
Disclosure: I am part of Trade Nation's Influencer program and receive a monthly fee for using their TradingView charts in my analysis.
———————————
WISH YOU ALL LUCK

NATGAS SWING SHORT|
✅NATGAS has been growing recently
And Gas seems locally overbought
So as the pair is approaching a
Horizontal resistance of 3.80$
Price decline is to be expected
SHORT🔥
✅Like and subscribe to never miss a new idea!✅
Disclosure: I am part of Trade Nation's Influencer program and receive a monthly fee for using their TradingView charts in my analysis.

NATGAS: Short Trading Opportunity
NATGAS
- Classic bearish formation
- Our team expects pullback
SUGGESTED TRADE:
Swing Trade
Short NATGAS
Entry - 3.667
Sl - 3.862
Tp - 3.269
Our Risk - 1%
Start protection of your profits from lower levels
Disclosure: I am part of Trade Nation's Influencer program and receive a monthly fee for using their TradingView charts in my analysis.
❤️ Please, support our work with like & comment! ❤️

NATGAS Resistance Ahead! Sell!
Hello,Traders!
NATGAS is growing sharply
But the price is nearing a
Strong horizontal resistance
Around 3.80$ so after the
Retest on Monday we will be
Expecting a local bearish
Correction as Gas is already
Locally overbought
Sell!
Comment and subscribe to help us grow!
Check out other forecasts below too!
Disclosure: I am part of Trade Nation's Influencer program and receive a monthly fee for using their TradingView charts in my analysis.

Natural gas prices may be poised for a short-term reboundNatural gas prices have fallen by nearly 30% since early March and now appear to have reached oversold conditions, suggesting a potential bounce of more than 10% back to $3.75 per million British thermal units. Natural gas has risen above its 10-day exponential moving average (EMA), indicating a possible short-term trend change. The 10-day EMA, which previously acted as resistance, could provide support as the commodity’s price increases. A failure to maintain it may signal that the attempted trend reversal has been unsuccessful.
Natural gas reached oversold conditions around 20 April, when its relative strength index (RSI) fell to 30 and prices touched the lower Bollinger Band. Momentum now appears to be shifting, with the RSI showing signs of turning upwards and potentially breaking its downtrend. If this positive momentum continues building, natural gas prices could rise towards their 20-day simple moving average (SMA) at $3.56. Should prices extend beyond the 20-day SMA, they could rise to $3.75, where prices consolidated for several days around early April.
A failure to reach the 20-day SMA, or an inability to push beyond that level, could suggest natural gas prices may fall back to retest recent lows around $3.05 to $3.10, with the potential to decline further towards the lower Bollinger Band at $2.85.
For now, natural gas prices indicate a possible short-term turnaround. However, prices will need to continue extending higher to confirm that a bottom has indeed been reached.
Written by Michael J Kramer, founder of Mott Capital Management
Disclaimer: CMC Markets is an execution-only service provider. The material (whether or not it states any opinions) is for general information purposes only and does not take into account your personal circumstances or objectives. Nothing in this material is (or should considered to be) financial, investment or other advice on which reliance should be placed.
No opinion given in the material constitutes a recommendation by CMC Markets or the author that any particular investment, security, transaction, or investment strategy is suitable for any specific person. The material has not been prepared in accordance with legal requirements designed to promote the independence of investment research. Although we are not specifically prevented from dealing before providing this material, we do not seek to take advantage of the material prior to its dissemination.

NATGAS Set To Fall! SELL!
My dear friends,
NATGAS looks like it will make a good move, and here are the details:
The market is trading on 2.964 pivot level.
Bias - Bearish
Technical Indicators: Supper Trend generates a clear short signal while Pivot Point HL is currently determining the overall Bearish trend of the market.
Goal - 2.929
About Used Indicators:
Pivot points are a great way to identify areas of support and resistance, but they work best when combined with other kinds of technical analysis
Disclosure: I am part of Trade Nation's Influencer program and receive a monthly fee for using their TradingView charts in my analysis.
———————————
WISH YOU ALL LUCK

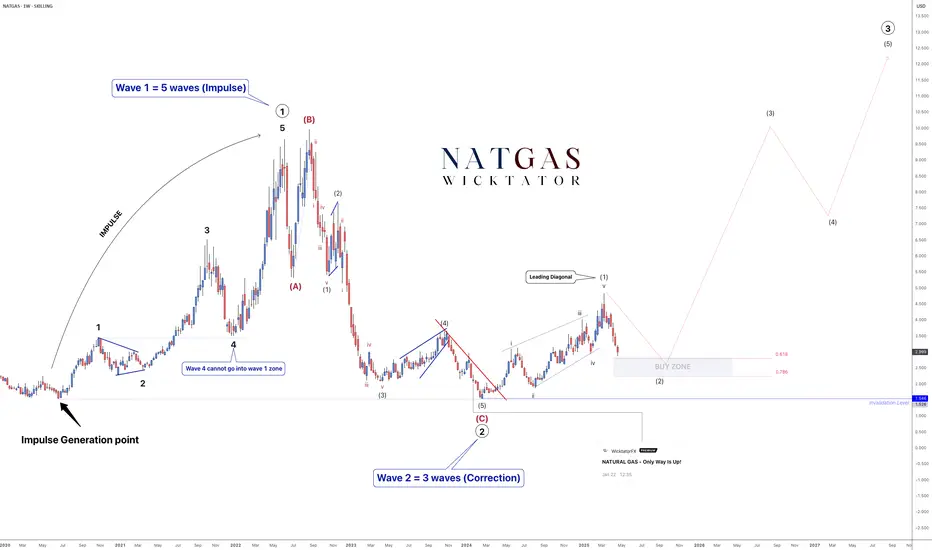
NATGAS Elliott Waves – Preparing for a Multi-Year Rally!Following our last post on Natural Gas, we have now seen a breakout, suggesting the start of a larger bullish wave — a move that could last multiple years.
From a technical perspective:
- Wave 1 (5-wave impulse) is complete.
- Wave 2 (ABC correction) is also complete.
- We are now in Wave 3, which itself will form 5 subwaves.
Wave 3:
Subwave 1 of Wave 3 has formed as a leading diagonal.
We are now in Subwave 2, which typically retraces around 61.8% of Subwave 1.
Our buy zone is positioned around this retracement area, and we will be looking for a lower timeframe breakout to confirm entries.
Important note:
Subwave 2 could form a more complex ABC correction, so patience is required while it develops.
Trade Plan:
- Wait for price to reach the buy zone.
- Look for lower timeframe bullish confirmation (trendline break, BOS, structure shift, etc.).
- Enter after confirmation.
Stoploss Placement:
- Aggressive option: Below the corrective low.
- Conservative option: Below the broader invalidation level.
Targets: 8, 10, 12
See below for our last NatGas analysis:
NATGAS: Expecting Bearish Continuation! Here is Why:
It is essential that we apply multitimeframe technical analysis and there is no better example of why that is the case than the current NATGAS chart which, if analyzed properly, clearly points in the downward direction.
Disclosure: I am part of Trade Nation's Influencer program and receive a monthly fee for using their TradingView charts in my analysis.
❤️ Please, support our work with like & comment! ❤️

The Natural gas will make a dip once againNATURAL GAS H1 Analysis 📊
First of all , lets take about the gap
war , This gap is due to war and as you know market will refill it sooner or later , thats the main reason of the selling
Yes, no doubt , the market can go up for some sl hunting thats why the red zone is little wider
The ultimate trend is sell due to no investors in gas because all the investors are busy in the BITCOIN AND GOLD. so it will come back at its lowest support sooner or later
Follow the money management strictly and this is just the prediction.
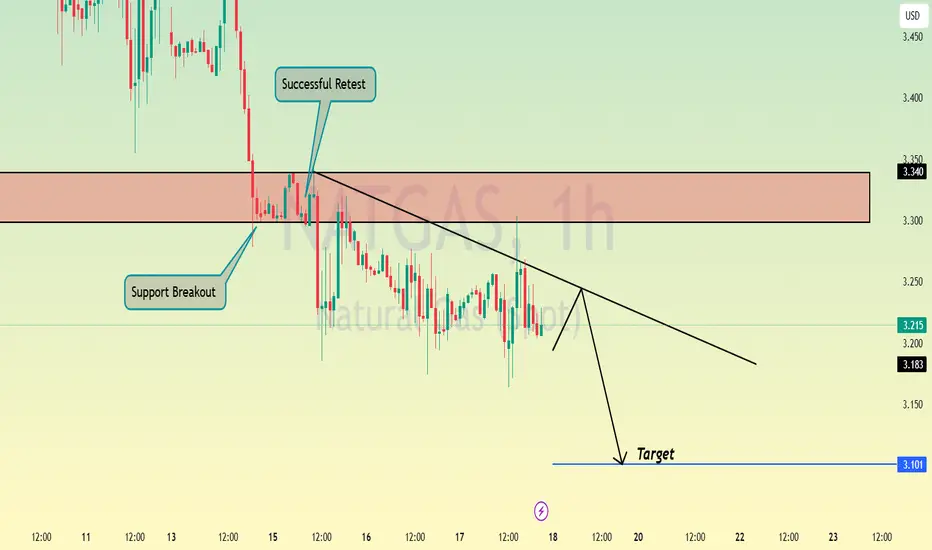
NATGAS - Bearish Head and ShouldersHello Traders !
The Natural Gas price formed a head and shoulders pattern.
Currently, The neckline is broken !
So, I expect a bearish move📉
_______________
TARGET: 3.2350🎯

Natural Gas | Oil | Dollar | Silver | Gold Price ForecastNatural Gas | Oil | Dollar | Silver | Gold Price Forecast
NYMEX:CL1! COMEX:SI1! COMEX:GC1! AMEX:UNG

NATGAS Swing Long! Buy!
Hello,Traders!
NATGAS went down after
The support cluster breakout
Just as we predicted in my previous
Analysis but price will soon hit a
Horizontal support level of 3.00$
From where we will be expecting
A local bullish correction
Buy!
Comment and subscribe to help us grow!
Check out other forecasts below too!
Disclosure: I am part of Trade Nation's Influencer program and receive a monthly fee for using their TradingView charts in my analysis.
