Natural Gas - BUY - rebound towards the resistance level.Despite the current downward pressure on the price of natural gas, it is expected to rebound towards the support level which has now turned into a resistance level, but may subsequently resume its downward trend. This could potentially create an opportunity for quick profits
Natgas

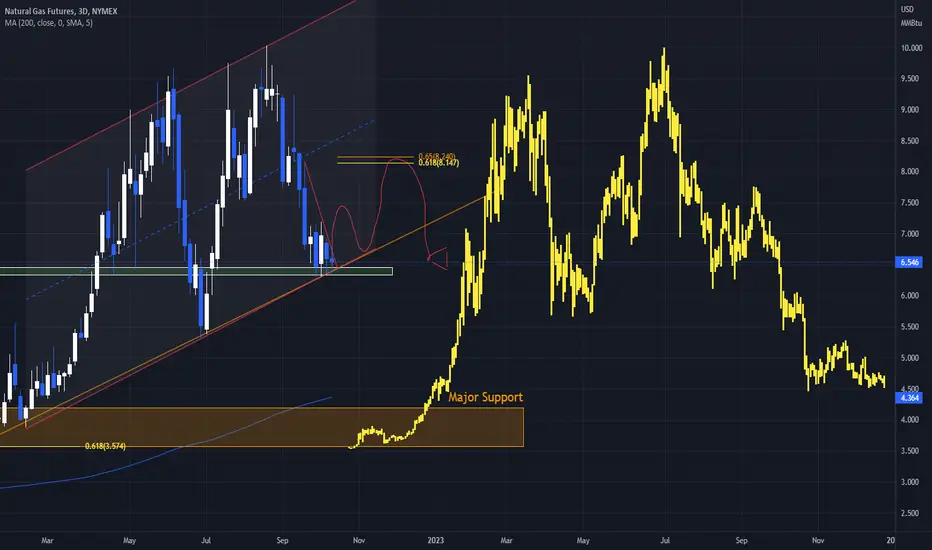
NATGAS Broke The Range! Sell!
Hello,Traders!
NATGAS is trading in a
Downtrend and the price
Broke out of the horizontal
Range so I think that
We will see bearish
Continuation
Sell!
Like, comment and subscribe to boost your trading!
See other ideas below too!

NG - Buy Set-up AheadNG has sustained an ugly sell off. Not unusual in this market. This is an opportunity for short and longer term gains I believe.
One needs to be prudent in selecting entry points in this market to manage risk. I believe we are now at that point.
I will be looking to get long next week. If you prefer an etf to use UNG chart below.
Ideally if A = C entry would be roughly $7.40 in UNG.

Feb 15,22-NG-serious sideways actionI can't say when NG will rise again with any significance, but it looks like NG has a floor around 2.350. This is about the low that NG has hit the last 3 weeks.
I'm putting in a standing Buy Order at 2.350
I expect price action to hit this level at some point over the next week or 2. I'm hoping not to miss the next rise up, maybe to 3? Even if it does, I'd say price will come right back down to the 2.5 area and hang out.
Whatever you trade, if you trade NG, keep a close eye on your trade. Lord knows the Big Boys can step in anytime and ruin most of us little people.
Stay safe all.
Heiko

Natural Gas - Long view for next tradeThis is my view for Natural gas in the short time.
If the price break the resistance area I will open a long trade with target near 3$ area..
Stop below tha actual minimum area with a very light loss.
dont't open long position without the breakout ...
only for speculation not for investment.

NatGas - MassacreI don't have a working cycle count in NatGas right now as I haven't traded it since it topped earlier last year.
This is a falling knife.
2 days ago we lost 3.300. That was the 2021.02.18 top and the Fibonacci 78,6% retracement level. As we broke below that level I see nothing until 2.442 and 2.267.
If anyone wants to long this needs to wait at least a reversal candlestick pattern but I wouldn't try any long position before price drops between 2.442 and 2.267.

Natural Gas: on watch for a breakout!We discuss the latest daily and intra day price action.
Some education about basing formation and what we need to see to gain likely more upside.

Natural Gas anticipating Wave 4Hello,
I think NATGAS completed wave(3) when it reached $2.41, if that support line hold, I expect a correction until $4.50 or even $5.00, however its too early to decide from which price wave 5 will start.
I believe the chart explain every thing. let me know if you have any comment.
good luck.
Nidal Khalid

Nat Gas Accumulation TimeWe're coming in to a zone near the $3 mark where we belive it would be prudent to start accumulating long positions in natural gas. Using Elliott Wave anaylsis in conjuction with fundamental analysis we're pretty certain there's a huge upside to natural gas. We're unsure as to whether this will be a wave 3 or a wave C to the upside, but ultimately that doesn't matter as both will provide us with an upside target of at least $10+. Fundamentally there will be a bigger surge in natural gas demand as it has become evident that the world is not ready for renewable energy to support our power needs (if it ever will be able to support us entirely) so 'cleaner' fuels such as natural gas will be used in the immediate and near term to meet the global energy demands. As always with trading we don't need to know everything, we just need to be on the right side of the movements to make money and we're pretty certain this is going to be a huge move to the upside in the coming weeks and months.

Feb 6,22-NG-Going down still or SidewayI zoomed out to the Weekly chart so you can see just how brutal the price has dropped over the last 8 weeks.
Question is, will it continue? Or is this going to be a bottom?
Answer is to wait this week out to see if price levels out or not. Obviously if price ends the week below 2.3 then we are still going down.
I'm looking for a decent close around 2.5 or 2.6. Then I will monitor price next week to see if there is a chance to break up to 3.
Remember we are heading into warmer weather soon and we have had a pretty warm winter overall so supplies are pretty full. Price may not do much for the next few months.
We shall see what happens. Stay safe.
Heiko

Natural Gas Outlook Short And Mid TermVery weird things are happening in the natural gas space. It might be getting ready for the biggest short squeeze.

Nat Gas looking oddly similar to BTC chart before a deep declineI am not saying this will happen, in fact I am personally bullish at the moment based on a number of factors. (For more on why I am bullish check out my channel for my nat gas trade)
I thought it was worth mentioning that BTC price action over the past few years is lining up very similarly to the price action of nat gas over the past year. Based on this vague information I am still bullish, but as I explain in my other post I will be bearish as we approach a particular zone. That is when I will pull this chart back up and compare the direction between the two prices.
Just something interesting to watch over the next few months!
NATURAL GAS-Pt.2- Short term bounce?In our previous post we explained how we believe that NaturalGas is ongoing an ABC correction from 9.995's top. Actually we believe to be finishing wave iii of C of this zig zag, as showed in the chart.
As explained in the previous post, we were waiting for the small red zone in chart between 2.4 and 2.5, where the algo tp of the whole move down and the level for which wave iii of C = 1.618 wave i of C, together with the target of the big head and shoulder pattern stand.
Since today we wicked that zone, we opened a long position at @2.471, and we are currently holding it with stop loss on entry.
Since the retail sentiment is still very extreme towards the long side and since this wave iii can still extend down, we are carefully posing our stop loss on entry. Target is 4.32. We will update below. Happy trading!

NATURAL GAS-Pt.1- Correction about to complete?Hello traders,
here is our view about natural gas.
As we can see from the monthly time frame, natgas completed an impulse after breaking a big descending triangle.
After reaching a top of 9.995, natgas created a head and shoulders pattern that coincided with a 535 structure to the downside, as showed in the main chart.
Then, wave 3 of C seems to be completed with an ending diagonal.
If the bullish macro count is in now we should go for another impulse up. Alternatively, we may get a (C) wave to complete
the monthly retracement higher than 10. In the latter case to move to 9.995 would only be a (A) cycle correction of the descent from 2005 high of 16.477.
In both cases, we expect a big buying opportunity coming soon in natural gas.
We are not taking long positions now for wave iv of C since sentiment in retail brokers is over 90% long.
When ALL the retailers are buying, who is selling to them? Who is gonna buy to actually put upward pressure on price?
This is why extreme sentiment is a contrary indicator.
We will update as soon as we see a long setup.

BOILMight be bottomed here, mothly stoch rsi shows weakness. Would say DCA down to $5 to catch this monster move.

Oil continues to oscillate within the wide range For some time now, we have been skeptical about the overly bullish narrative in the oil market. Additionally, we have disagreed with calls for a return to triple-digit prices while noting multiple times that oil was likely to be choppy throughout 2023, oscillating within a wide range. In fact, we later presented a similar view from the U.S. Energy Information Administration (EIA), which sees WTI crude oil average $77 per barrel in 2023. Today, we continue to stick to our previous assessment. Indeed, we are inclining toward the notion that oil will likely dip below $70 during the year (which may not be that far). However, we voice a word of caution as the price drop might be shortlived due to the U.S. administration seeking to refill its Strategic Petroleum Reserves (SPR) at the lower end of $70.
Illustration 1.01
Illustration 1.01 shows the daily chart of USOIL. If the price breaks below the sloping support, it will bolster the bearish odds in the short term.
Technical analysis
Daily time frame = Bearish
Weekly time frame = Neutral
Illustration 1.02
Illustration 1.02 displays the daily chart of USOIL. Additionally, it shows two simple moving averages (SMAs). The yellow arrow indicates the price retracement toward these SMAs. If the price holds above them, it will be bullish. Contrarily, if the price breaks below SMAs, it will be bearish in the short-term.
Please feel free to express your ideas and thoughts in the comment section.
DISCLAIMER: This analysis is not intended to encourage any buying or selling of any particular securities. Furthermore, it should not be a basis for taking any trade action by an individual investor. Therefore, your own due diligence is highly advised before entering a trade.

Jan 30,22-NG-Almost long? Not so much!So NG price gapped down from the Big Boys on the weekend, putting the price of NG to almost a 2 year low. Not good for people like me that wanna go LONG and make some money.
Anyway, hold onto your shorts and keep waiting for the low...someone told me maybe 2.5 - looks like maybe they were correct :-)
Anyway, I'm still waiting (isn't that a song?) - doesn't look like anything is gonna change anytime soon. While the U.S. is in a cold snap right now, the long term forecast says seasonal norms so I don't see any crazy price spikes coming anytime soon.
Guess we shall see if we can trade the S n P 500 on Wed depending on how much the Fed raises rates.
Stay safe all.
Heiko


$Natgas $UNG $BOIL $KOLD Analysis, Key levels, and Targets $Natgas $UNG $BOIL $KOLD Analysis, Key levels, and Targets
Holy Moly…. I’ve been out of natgas for a minute… but at this level I’m going to start accumulating…. Let’s see how we open but I will likely be buying April 21 8 or 9 calls in the morning….
Supported by 5 year volume…

natural gas at it's historical low, back to 2012Besides the initial fallout of the pandemic, natural gas has never been so cheap against USD-M2 -- Buy when cheap ✔
WHEN it moves, it'll be big, waiting for confirmation
It could drop lower in the very short-term, and after that... balloons
BEWARE THE BEAST

Will Exxon march higher or perform a fake out?Since our previous post on Exxon Mobil, it has increased significantly in value against our expectations. Unfortunately, with the upcoming earnings, the stock might get an additional boost in price, which is already hovering near all-time highs. As a result, XOM breaking above $114.66 will force us to abandon our price target on the downside. However, even if a breakout occurs, we will continue to pay close attention to subsequent price action and monitor volume very closely. To support the idea of a fakeout, we would like to see a continual drop in volume accompanying price growth on the daily chart (just like on the monthly chart). As for the outlook beyond the short-term, we remain worried that ranging oil prices between $70 and $85 per barrel will threaten the well-being of this stock title. Furthermore, higher taxes on energy companies, economic slowdown, and oil down more than 35% since its 2022 peak will put pressure on further price increases.
Illustration 1.01
Illustration 1.01 shows the hourly chart of XOM. The yellow arrow points to a technical glitch at NYSE, which saw multiple stock companies plunge and turn on circuit breakers. We can potentially discard this movement.
Illustration 1.02
Illustration 1.02 displays the monthly chart of XOM. The red arrow indicates a continual decline in volume, which is a bearish technical development.
Illustration 1.03
Illustration 1.03 shows the daily chart of XOM and the updated setup.
Please feel free to express your ideas and thoughts in the comment section.
DISCLAIMER: This analysis is not intended to encourage any buying or selling of any particular securities. Furthermore, it should not be a basis for taking any trade action by an individual investor. Therefore, your own due diligence is highly advised before entering a trade.

Natural gas retrace to 5$My pervious short thesis turned out to be right. The price dropped basically on political brute-force and I believe it still has another one leg up.
A calculated long position with a stop loss worth's the risk. I am going for a long position and will close below the major obvious resistance

US Natural Gas USDNTGI entered long position at 2.73
Freeport LNG is going to open soon after months of being offline. Export of US LNG to EU will resume which will lower EU prices and rise USA prices.
