NATURAL GAS expected move Elliot Wave - NATGAS NATURALGASNATURAL GAS expected move Elliot Wave - NATGAS NATURALGAS
WAVE C PENDING - expected heading towards $4-$4.3
Natgas


USOIL - 100 USD hit, 95 USD hit... what is next?Our price targets of 100 USD and 95 USD were reached recently. Despite that, we continue to be bearish on USOIL. Accordingly, we still maintain our price target of 90 USD, which we would like to change from long-term to medium-term.
Illustration 1.01
Illustration 1.01 shows the daily chart of USOIL and two moving averages, 20-day SMA and 50-day SMA. These moving averages reflect the downtrend.
Technical analysis - daily time frame
RSI and Stochastic are bearish. MACD is bearish too. DM+ and DM- are bearish. Overall, the daily time frame is bearish.
Technical analysis - weekly time frame
RSI, MACD, Stochastic, DM+, and DM- are all bearish. Overall, the weekly time frame is bearish.
Please feel free to express your ideas and thoughts in the comment section.
DISCLAIMER: This analysis is not intended to encourage any buying or selling of any particular securities. Furthermore, it should not be a basis for taking any trade action by an individual investor. Therefore, your own due diligence is highly advised before entering a trade.

Natural Gas time to easy Rally To evaluate the trend of Natural Gas we must take into account 2 factors:
1) The international macro political scenarios:
Russia, which is the world's leading producer, will export less to its main customer the European Union.
Winter in Europe is upon us and there is a serious risk of an energy blockade, Europe will find GAS but the cost from September onwards will be very high with the main natural gas producer out of the market.
2) Graphically we can deduce a strongly bullish graphic structure where increasing minimums and maximums constantly lean on well-defined supports, the price above the moving averages 100, 200 and the fibonacci extension speaks clearly the price should orbit soon at the price of $ 15.
GAS export data:
In 2020, the 5 largest gas exporters in the world were Russia (199,928 mcm), United States (149,538 mcm), Qatar (143,700 mcm), Norway (112,951 mcm), Australia (102,562 mcm).
Winter is coming (Cit 'GOT)
LPI.sa

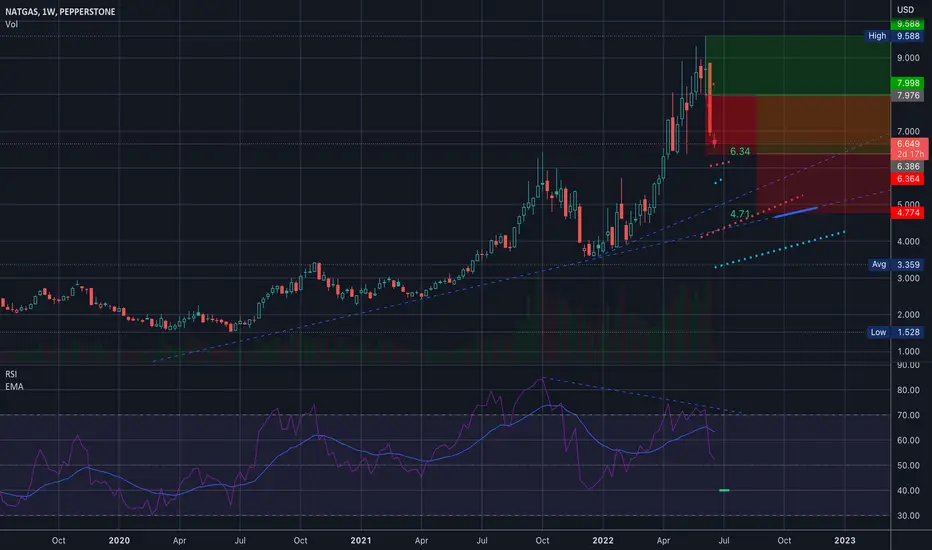
NatGas: Pretty in PinkNatGas would look really pretty in pink, wouldn’t it? Therefore, it should proceed to move downwards to complete wave ii in pink in the upper pink zone between $6.055 and $5.325. Afterwards, it should turn around and climb upwards, crossing the resistance at $6.786 and heading for the next one at $8.118. There is a 33% chance, though, that NatGas could acquire taste for more pink, drop below the support at $5.325 and into the lower pink zone between $4.835 and $4.205.

EURUSD - reopening of the Nord Stream 1 - a major vol event?Talk of an unfolding energy crisis in Europe is well known, but we now come to a more defining and almost binary point in the proceedings – one EUR, commodity and EU equity traders should be aware of as a major event risk.
On 21 July, the Russians will need to make the call to resume the flow of natural gas (NG) through the Nord Stream 1 pipeline – the pipeline, which supplies c.10% of Europe’s consumption was closed this week for maintenance and is due to re-open on 21 July – or at least that is the plan.
Supply through the pipeline that transports NG from Russia to Germany has fallen some 60% since June, due to a mix of sanctions and because a key turbine used to pump the gas was removed and sent back to Canada for maintenance and has remained there due to global sanctions. The Europeans, notably, the Germans and Italians, are concerned the Russians may use the unavailability of the turbine as a pawn to halt the restarting of flow on 21 July.
Various news wires have suggested the Canadians, under some pressure from Germany, have agreed to export the turbine back to Germany, but Gazprom has suggested they’ve not yet seen any documents providing evidence the turbine will be allowed to return. Naturally, the concern is if Russia does not restart the flow, we could see European NG inventories fast depleted, and any hope they could build them through the July to September period, and ahead of the winter, reduced. Talk of gas rationing is certainly elevated and it could significantly impact EU inflation and lower growth. It would make the job of the ECB, which is largely expected to hike rates by 25bp on 21 September, far more challenging.
The Europeans would look to the LNG market as an alternative, but that market is already very tight, with sizeable demand out of Asia.
Current inventory levels are manageable and can supply European demands through the winter period, but much now relies on the future flow from Russia. Russia seemingly holds the cards and will be acutely aware that if they don’t restart the flow then EU NG prices could push from current levels of E180 per MWh and above E200 MWh. In a world where most commodities are trending lower, EU NG prices are appreciating rapidly and with falling growth and consumer sentiment, this is a toxic mix for Europe.
While we can look at relative excepted interest rate settings, terms of trade or other traditional metrics that showcase the relative attractiveness as an investment destination – the simple fact is that EURUSD and EU NG prices are incredibly negative correlated and seem to have the strongest statistical relationship. The 21-day rolling correlation between the two variables is -0.88.
Taking that into account, it almost seems binary that EURUSD will move in anticipation of the outcome of Russia’s decision on 21 July. We can argue that EURUSD is already pricing in a large degree that Nord Stream 1 won't restart immediately, so that needs to be considered.
Of course, in the near-term, the pair will move on other factors but it’s time to put the 21 July and Russia's call on flow on the radar, because FX traders will be watching closely and reacting to headlines – any view that the flow will resume, even at a lower rate than before the recent halt, could lead to relief that Germany (and other nations) may not have to ration gas through the winter period, in turn, driving a market short of EURUSD into 1.0150/1.0200 and pushing the GER40 higher. Of course, if they hold off then it could set a new leg lower in EU assets.
An event risk to put on the radar.

Natgas Day TF - butterfly pattern assumption - July 2022Following the theory, the X-A leg is the first leg of the price fall, then follow by the A-B leg up retracing 78.6%, then leg down to B-C leg retrace 38.2% - 88.6% and the final leg is C-D which normally price would go up to 127% or 161.8%.
if price follow as I drew, I would enter my long position from the low of C-D leg and take profit accordingly.
Please note, this is not a financial advice
Please feel free to comment - thanks!

Major Bottom in These Nat Gas Producers: CRK & SWNWith natural gas setting up for a possible parabolic advance (or likely elevated prices), I am looking for great set-ups in nat gas producers.
SWN:
These types of structures have multi-bagger written all over them.

NATGAS Local Long! Buy!
Hello,Traders!
NATGAS is trading in a downtrend
But we are seeing the pair retest
A strong horizontal support
And given that the pair is oversold
We are bound to see some correction
Buy!
Like, comment and subscribe to boost your trading!
See other ideas below too!


Jul 4, 22 NG Almost time to short?Looking at the way NG has been playing out over the last couple weeks, it looks like it just drop, levels off, drops again - repeat!!
So I'm thinking it might hit 6 and then drop off again. We shall see.
Heiko

NG! Coming down to earth? Or further price appreciation?NG! has had a historic two-year bull rally. Is the fun over for nat gas traders?
Fundamentally little has changed regarding the supply and demand of U.S nat gas despite the last few weeks of intense selling, with exception of a temporary surplus of U.S nat gas supply due to a fire in a Freeport export terminal.
Global weather remains extreme. Nat gas supply globally remains low compared to historical levels. Not to mention the effect of the added complications on the global energy trade from the war in Europe and the sanctions related to it. I think with all the uncertainties in today's world, a nat gas long position at these depressed prices (depressed on a short-term basis) at the very least provides some form of a hedge on the risk of escalation in the Russia-Ukraine war and/or worsening inflation.
Current Prices seem relatively attractive for a trade, but short-term momentum could push NG! down to the 4.54 support area. The 4.54 area would be an ideal entry for going long given that the fundamental narrative on U.S nat gas remains favorable.
This is not trading advice. Good luck!

Commodity relief?Another corrective move for a commodity. Look for a retest of that blue zone with an R of 3. Buy stop@ 5.674

$UNG Analysis, Key levels & Targets$UNG Analysis, Key levels & Targets
NatGas is starting to look very interesting again… what a monster drop today, though!! I will be looking to get into a position tomorrow… I’ll update here with whatever long position I end up taking…
I love trading natgas and it has been too long…
—-
I am not your financial advisor. Watch my setups first before you jump in… My trade set ups work very well and they are for my personal reference and if you decide to trade them you do so at your own risk. I will gladly answer questions to the best of my knowledge but ultimately the risk is on you. I will update targets as needed.
GL and happy trading.
IF you need anything analyzed Technically just comment with the Ticker and I’ll do it as soon as and if possible…

NATGAS WK: 250%+ gains BEST level to BUY/HOLD (SL/TP)(SWING)Why get subbed to to me on Tradingview?
-TOP author on TradingView
-15+ years experience in markets
-Professional chart break downs
-Supply/Demand Zones
-TD9 counts / combo review
-Key S/R levels
-No junk on my charts
-Frequent updates
-Covering FX/crypto/US stocks
-24/7 uptime so constant updates
NATGAS WK: 250%+ gains BEST level to BUY/HOLD (SL/TP)(SWING)
IMPORTANT NOTE: speculative setup. do your own
due dill. use STOP LOSS. don't overleverage.
🔸 Summary and potential trade setup
::: NATGAS weekly price chart review
::: chart looks strong / favors BULLS
::: natural gas STRONG BULL MARKET
::: 200% upside from current level
::: massive breakout in progress
::: expanding triangle bottom formation
::: we just got a clean breakout of the pattern
::: best strategy: BUY DIPS / ACCUMULATE DIPS
::: best reload BULLS: 4.50-5.50 USD range
::: TP bulls is 250% gains final TP 14-15 USD
::: we are currently entering commodities super cycle
::: prices are set to increase 100-300% over next 24 months
::: speculative setup always do your own due dill
::: fresh liquidity will be targeted by BULLS
::: BUY/HOLD setup do not expect miracle/fast gains
🔸 Supply/Demand Zones
::: N/A
::: N/A
🔸 Other noteworthy technicals/fundies
::: TD9 /Combo update: N/A
::: Sentiment mid-term: BULLS/SUPERCYCLE
::: Sentiment outlook short-term: BEARS/PULLBACK
RISK DISCLAIMER:
Trading Crypto, Futures , Forex, CFDs and Stocks involves a risk of loss.
Please consider carefully if such trading is appropriate for you.
Past performance is not indicative of future results.
Always limit your leverage and use tight stop loss.

NATGAS Risky Long! Buy!
Hello,Traders!
NATGAS is now retesting a key horizontal level
And despite the fact that it is on the very edge
I think we still might see the local bullish correction
Because the level is strong and it was not yet broken
Buy!
Like, comment and subscribe to boost your trading!
See other ideas below too!

NATURAL GAS - Trade of the Summer (thanks Biden)A perfect entry FXPROFESSOR Style and a 35% drop in 15 days .. A trader can never ask for anything more than that.
The charts don't lie and when an alert goes off from TRADINGVIEW we don't even look at the chart: we just went short without delay.
NEWS:
The FREEPORT LNG TERMINAL FIRE made things better for our trade as more supply with same demand for US Natgas... it also made things even worse for Germany and Europe...
LEt's see what happens next as Europe must find ways to make peace with Russia soon.
One Love,
the FXPROFESSOR

NATGAS Has a bit of up side before major breakdownI was recently short on NATGAS and made a good profit...now I am willing to risk some of that profit to go long for a short term.
This can come down a bit more but has a bit of upside, before major collapse to 5$ level of before war time.

Natural Gas (NATGASUSD): Be Prepared For a Bullish Move💨
Multiple time frame analysis on Natural gas.
Price action, structure & key levels.
Your detailed trading plan.
❤️If you have any questions, please, ask me in the comment section.
Please, support my work with like, thank you!❤️

$NATGAS $KOLD $BOIL Analysis, Key levels & Targets$NATGAS $KOLD $BOIL Analysis, Key levels & Targets
No game plan yet… but I’m looking…
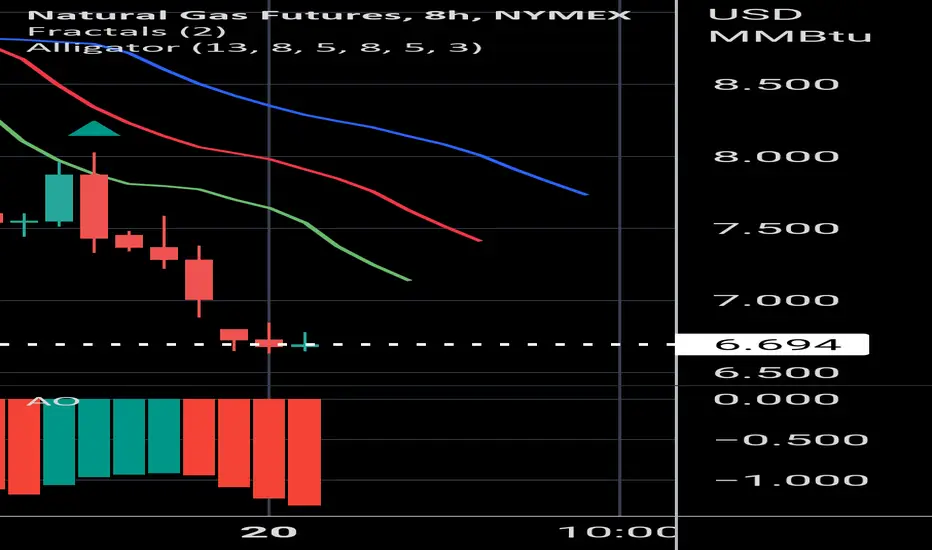
Long Natural GasNatural Gas futures have retraced the 2022 bull trend to a 50% Retracement Level at 6.60. Price needs to hold this level or else it risks giving up the 2022 trend.
This trade was prompted by a 30 minute timeframe Spike Alert this morning that pegged the broader trend level and sets up a low risk test. Stop alert below the morning low and an initial target a Retrace of the move down.
Some D****** members chose AMEX:BOIL to express the trade (more volatility for more gains) and I chose AMEX:UNG as the vehicle.

NATGAS LongHey,
I think NATGAS is oversold. The price has dropped some 30% from the top, partly because 2% of the US demand abruptly seized, as Freeport LNG had an explosion, and are delaying restart of the facilities.
Never know what happens in this volatile market, but as long as the conflicts between Russia and the west continues, I believe NATGAS is going to continue upwards soon. Be careful though!
Kind regards and God be with you,
Thomchris777

Jun 20, 22 NG time to go long?So I heard Germany will have to fire up their coal plants due to Russia clamping down on their supply of NG to Germany.
I don't know if this will affect U.S. NG or not, but considering how far NG has fallen in the last 3 days or so, I imagine NG might go back up 500 points or so this week.
Let me know your thoughts.
Stay safe.
Heiko