NATGAS - Long activeThe idea is based on the hit of a big long accumulation volume area.
We can have a long wave for the next days.
Natgas

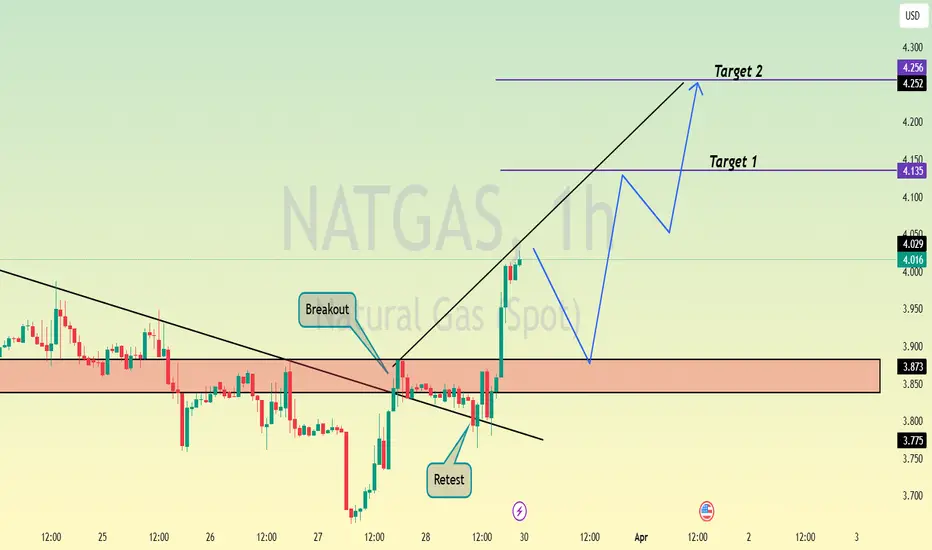
NATGAS - Long TriggerI have a triger for a Long with target around 4,2$
Stop below actual support zone

NATGAS Resistance Cluster Above! Sell!
Hello,Traders!
NATGAS made a bearish
Breakout of the support
Cluster of the rising and
Horizontal support levels
Which is now a resistance
Cluster round 3.717$ then
Went down and made a local
Pullback on Thursday and
Friday but we are bearish
Biased mid-term so we
Will be expecting a further
Bearish move down this week
Sell!
Comment and subscribe to help us grow!
Check out other forecasts below too!
Disclosure: I am part of Trade Nation's Influencer program and receive a monthly fee for using their TradingView charts in my analysis.

Natural Gas | Oil | Dollar | Silver | Gold Price ForecastNatural Gas | Oil | Dollar | Silver | Gold Price Forecast
NYMEX:CL1! COMEX:SI1!

Natural Gas is in the Buy DirectionHello Traders
In This Chart NATGAS HOURLY Forex Forecast By FOREX PLANET
today NATGAS analysis 👆
🟢This Chart includes_ (NATGAS market update)
🟢What is The Next Opportunity on NATGAS Market
🟢how to Enter to the Valid Entry With Assurance Profit
This CHART is For Trader's that Want to Improve Their Technical Analysis Skills and Their Trading By Understanding How To Analyze The Market Using Multiple Timeframes and Understanding The Bigger Picture on the Charts

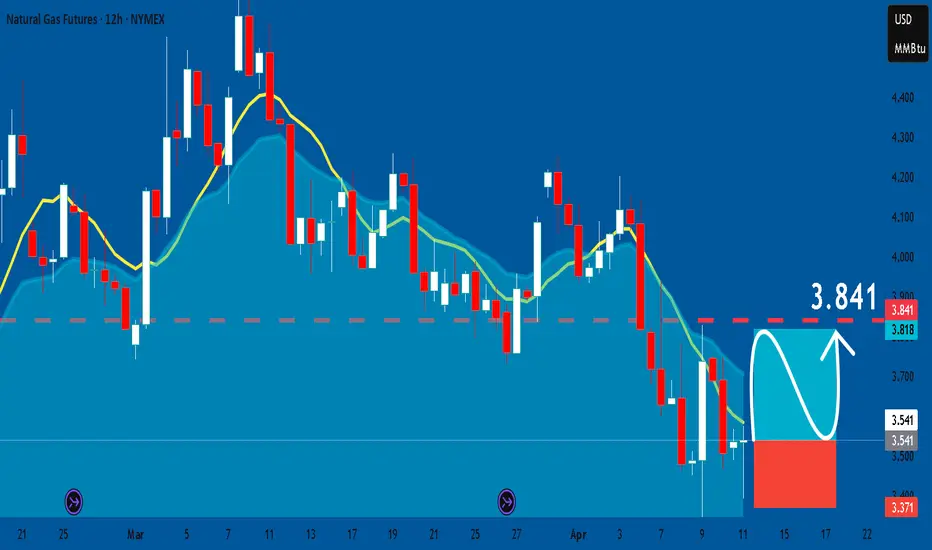
NATGAS: Long Trade Explained
NATGAS
- Classic bullish formation
- Our team expects pullback
SUGGESTED TRADE:
Swing Trade
Long NATGAS
Entry - 3.541
Sl - 3.371
Tp - 3.841
Our Risk - 1%
Start protection of your profits from lower levels
Disclosure: I am part of Trade Nation's Influencer program and receive a monthly fee for using their TradingView charts in my analysis.
❤️ Please, support our work with like & comment! ❤️
NATGAS Expected Growth! BUY!
My dear followers,
This is my opinion on the NATGAS next move:
The asset is approaching an important pivot point 3.541
Bias - Bullish
Safe Stop Loss - 3.373
Technical Indicators: Supper Trend generates a clear long signal while Pivot Point HL is currently determining the overall Bullish trend of the market.
Goal - 3.834
About Used Indicators:
For more efficient signals, super-trend is used in combination with other indicators like Pivot Points.
Disclosure: I am part of Trade Nation's Influencer program and receive a monthly fee for using their TradingView charts in my analysis.
———————————
WISH YOU ALL LUCK

NATGAS Found Support at $3.43: Next Target Could be $3.084FenzoFx—NATGAS failed to stabilize below the $3.43 support, resulted in the prices to bounce. As of this writing, Natural Gas trades slighlty above the support.
From a technical perspective. The recent bounce in the price couldn't form a new higher high. Therefore, it is expected for the prices to fall. But, bears must close and stabilize below the $3.43 support for the downtrend to resume.
>>> Win $160.0 weekly by participating FenzoFx Forex Contest for free.

NATGAS - Long Opportunity with a H&S TF 15 minThere is a H&S configuration.
We have to break the neck line.. if is will happen, we can have a new long wave until area 4.2

NATGAS Local Bearish Pullback Expected! Sell!
Hello,Traders!
NATGAS is about to hit
A strong horizontal resistance
Level of 3.880$ after a sharp
Push upwards by the bulls
So a local correction is needed
From the resistance with the
Expected target being the
Local level below at 3.655$
Sell!
Comment and subscribe to help us grow!
Check out other forecasts below too!
Disclosure: I am part of Trade Nation's Influencer program and receive a monthly fee for using their TradingView charts in my analysis.

NATGAS Bearish Breakout! Sell!
Hello,Traders!
NATGAS made a bearish
Breakout of the key horizontal
Resistance of 3.626$ and the
Breakout is confirmed so we
Are bearish biased and we will
Be expecting a further
Bearish move down
Sell!
Comment and subscribe to help us grow!
Check out other forecasts below too!
Disclosure: I am part of Trade Nation's Influencer program and receive a monthly fee for using their TradingView charts in my analysis.

NATGAS is Bearish amid Oversold SignalsFenzoFx—NATGAS is in a downtrend, broke below the $3.66 support. The primary trend is bearish, but a consolidation phase is expected.
In this scenario, Natural Gas may test the 50.0% Fibonacci retracement level at $3.866 before the downtrend resumes. Watch this level for bearish signals, like candlestick patterns.
>>> Trade NATGAS without swap at FenzoFx Decentralized Broker

NATGAS BEARISH BREAKOUT|SHORT|
✅NATGAS formed a head
And shoulders pattern then
Made a bearish breakout of
The neckline which is now
A resistance of 3.850$
And the breakout is confirmed
So we are bearish biased and
We will be expecting a
Further bearish move down
SHORT🔥
✅Like and subscribe to never miss a new idea!✅
Disclosure: I am part of Trade Nation's Influencer program and receive a monthly fee for using their TradingView charts in my analysis.

Gold | Oil | Dollar | Silver | Natural Gas Price ForecastGold | Oil | Dollar | Silver | Natural Gas Price Forecast

NATGAS Technical Analysis! BUY!
My dear friends,
My technical analysis for NATGAS is below:
The market is trading on 3.819 pivot level.
Bias - Bullish
Technical Indicators: Both Super Trend & Pivot HL indicate a highly probable Bullish continuation.
Target - 3.970
Recommended Stop Loss - 3.740
About Used Indicators:
A pivot point is a technical analysis indicator, or calculations, used to determine the overall trend of the market over different time frames.
Disclosure: I am part of Trade Nation's Influencer program and receive a monthly fee for using their TradingView charts in my analysis.
———————————
WISH YOU ALL LUCK

NATGAS SUPPORT AHEAD|LONG|
✅NATGAS will soon retest a key support level of 3.728$
So I think that the pair will make a rebound
And go up to retest the supply level above at 3.887
LONG🚀
✅Like and subscribe to never miss a new idea!✅
Disclosure: I am part of Trade Nation's Influencer program and receive a monthly fee for using their TradingView charts in my analysis.

NATGAS: Bulls Will Push
The price of NATGAS will most likely increase soon enough, due to the demand beginning to exceed supply which we can see by looking at the chart of the pair.
Disclosure: I am part of Trade Nation's Influencer program and receive a monthly fee for using their TradingView charts in my analysis.
❤️ Please, support our work with like & comment! ❤️

NATGAS Free Signal! Buy!
Hello,Traders!
NATGAS went down again
But will soon hit a horizontal
Support level around 3.784$
So after the retest we can go
Long on Gas with the Take
Profit of 3.907$ and the
Stop Loss of 3.725$
Buy!
Comment and subscribe to help us grow!
Check out other forecasts below too!
Disclosure: I am part of Trade Nation's Influencer program and receive a monthly fee for using their TradingView charts in my analysis.

NATGAS - Head and Shoulder pattern? - SHORTI see a potential H&S pattern short in formation
It can be completed with break of neck line ..
Aggressive trade can be do with an entry and stop loss above the actual max.

Natural Gas is in the Buying DirectionHello Traders
In This Chart NATGAS HOURLY Forex Forecast By FOREX PLANET
today NATGAS analysis 👆
🟢This Chart includes_ (NATGAS market update)
🟢What is The Next Opportunity on NATGAS Market
🟢how to Enter to the Valid Entry With Assurance Profit
This CHART is For Trader's that Want to Improve Their Technical Analysis Skills and Their Trading By Understanding How To Analyze The Market Using Multiple Timeframes and Understanding The Bigger Picture on the Charts
NATGAS - Plan B If break of structure - shortNATGAS - Plan B If break of structure
If NATAGAS break support dynamic trend line we can have an accelation until a below support area at 3.1

NATGAS - long strategy for dump actionAfter a morning with a push down in the demand area we have a return of buy in this market. The final candle is a rejection of short so I expected a new long phase in the next days.

NATGAS Technical AnalysisFenzoFx—NATGAS broke above the trendline, surpassing $4.0, but is short-term overbought. It trades around $4.135, holding above the 50-SMA, with a bullish target at $4.26.
A drop below $3.906 (50% Fibonacci) could target $3.660 instead.
