NATGAS: Expecting Bearish Movement! Here is Why:
Looking at the chart of NATGAS right now we are seeing some interesting price action on the lower timeframes. Thus a local move down seems to be quite likely.
Disclosure: I am part of Trade Nation's Influencer program and receive a monthly fee for using their TradingView charts in my analysis.
❤️ Please, support our work with like & comment! ❤️
Natgas

NATGAS: Market of Sellers
Remember that we can not, and should not impose our will on the market but rather listen to its whims and make profit by following it. And thus shall be done today on the NATGAS pair which is likely to be pushed down by the bears so we will sell!
Disclosure: I am part of Trade Nation's Influencer program and receive a monthly fee for using their TradingView charts in my analysis.
❤️ Please, support our work with like & comment! ❤️

NATGAS Growth Ahead! Buy!
Hello,Traders!
NATGAS made a retest
Of the horizontal support
Level of 3.720$ and we are
Seeing a nice strong bullish
Rebound so we are bullish
Biased and we will be
Expecting a further bullish
Move up
Buy!
Comment and subscribe to help us grow!
Check out other forecasts below too!
Disclosure: I am part of Trade Nation's Influencer program and receive a monthly fee for using their TradingView charts in my analysis.

NATGAS - NEW BREAKDOWNHello Traders !
On Monday 10 March, The NATGAS reached the resistance level (4.730 - 4.986).
Currently, The support level (4.368 - 4.218) is broken !
This key level becomes new resistance.
So, I expect a bearish move📉
______________
TARGET: 3.885🎯

Natural Gas | Gold | Oil | Dollar | Silver Price ForecastMultiple time frame analysis
Support and resistance Levels |
Natural Gas | Gold | Oil | Dollar | Silver Price Forecast

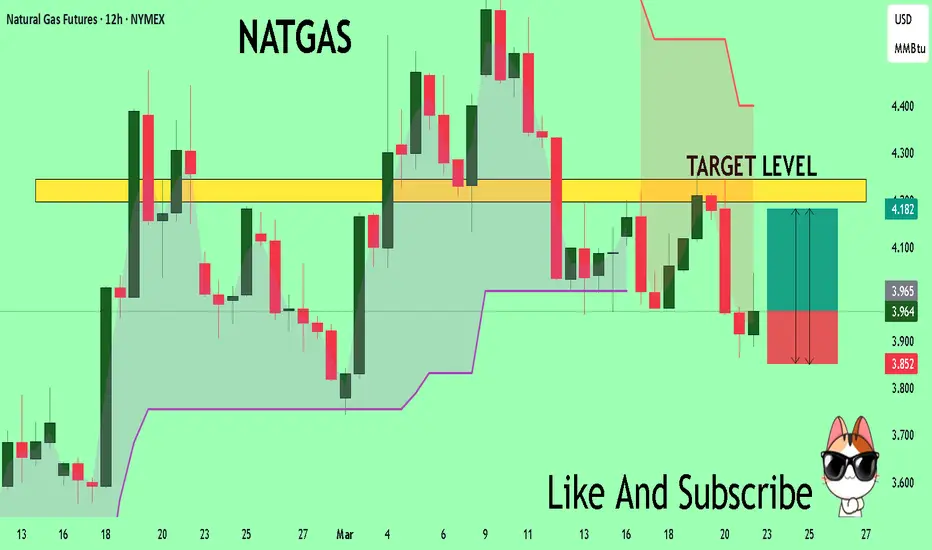
NATGAS: Trading Signal From Our Team
NATGAS
- Classic bullish formation
- Our team expects pullback
SUGGESTED TRADE:
Swing Trade
Long NATGAS
Entry - 3.964
Sl - 3.800
Tp - 4.264
Our Risk - 1%
Start protection of your profits from lower levels
Disclosure: I am part of Trade Nation's Influencer program and receive a monthly fee for using their TradingView charts in my analysis.
❤️ Please, support our work with like & comment! ❤️

NATGAS What Next? BUY!
My dear friends,
Please, find my technical outlook for NATGAS below:
The instrument tests an important psychological level 3.964
Bias - Bullish
Technical Indicators: Supper Trend gives a precise Bullish signal, while Pivot Point HL predicts price changes and potential reversals in the market.
Target - 4.197
Recommended Stop Loss - 3.852
About Used Indicators:
Super-trend indicator is more useful in trending markets where there are clear uptrends and downtrends in price.
———————————
WISH YOU ALL LUCK
Sell targets on the daily timeframe: 3.41, 3.282.Hello traders and investors!
The price has been near the upper boundary of the sideways range at 4.358 for a couple of weeks. The buyer failed to hold above 4.5, even with increasing volume. The seller absorbed the buying pressure and formed a seller's zone (red rectangle).
Sell targets on the daily timeframe: 3.41, 3.282.
I wish you profitable trades!

Natural Gas still coiling! breakdown or breakout?Hello Traders
In This Chart NATGAS HOURLY Forex Forecast By FOREX PLANET
today NATGAS analysis 👆
🟢This Chart includes_ (NATGAS market update)
🟢What is The Next Opportunity on NATGAS Market
🟢how to Enter to the Valid Entry With Assurance Profit
This CHART is For Trader's that Want to Improve Their Technical Analysis Skills and Their Trading By Understanding How To Analyze The Market Using Multiple Timeframes and Understanding The Bigger Picture on the Charts

NATGAS Trading Opportunity! BUY!
My dear friends,
Please, find my technical outlook for NATGAS below:
The price is coiling around a solid key level - 4.089
Bias - Bullish
Technical Indicators: Pivot Points High anticipates a potential price reversal.
Super trend shows a clear buy, giving a perfect indicators' convergence.
Goal - 4.280
Safe Stop Loss - 3.977
About Used Indicators:
The pivot point itself is simply the average of the high, low and closing prices from the previous trading day.
———————————
WISH YOU ALL LUCK

NATGAS BULLISH BREAKOUT|
✅NATGAS is trading in an
Uptrend and the price made
A strong bullish breakout
Of the key level of 4.400$
Which is now a support
So we will be expecting
A further bullish move up
LONG🚀
✅Like and subscribe to never miss a new idea!✅

Gold | Oil | Dollar | Silver | Natural Gas Price ForecastFutures Commodities Forecast | Gold | Oil | Dollar | Silver | Natural Gas Price Forecast
COMEX:GC1! NYMEX:NG1! NYMEX:CL1! COMEX:SI1!

NATGAS Set To Fall! SELL!
My dear followers,
I analysed this chart on NATGAS and concluded the following:
The market is trading on 4.401 pivot level.
Bias - Bearish
Technical Indicators: Both Super Trend & Pivot HL indicate a highly probable Bearish continuation.
Target - 4.316
About Used Indicators:
A super-trend indicator is plotted on either above or below the closing price to signal a buy or sell. The indicator changes color, based on whether or not you should be buying. If the super-trend indicator moves below the closing price, the indicator turns green, and it signals an entry point or points to buy.
———————————
WISH YOU ALL LUCK

NATGAS: Bearish Continuation & Short Trade
NATGAS
- Classic bearish formation
- Our team expects fall
SUGGESTED TRADE:
Swing Trade
Sell NATGAS
Entry Level - 4.401
Sl - 4.546
Tp - 4.137
Our Risk - 1%
Start protection of your profits from lower levels
Disclosure: I am part of Trade Nation's Influencer program and receive a monthly fee for using their TradingView charts in my analysis.
❤️ Please, support our work with like & comment! ❤️


NATGAS What Next? BUY!
My dear friends,
My technical analysis for NATGAS is below:
The market is trading on 3.819 pivot level.
Bias - Bullish
Technical Indicators: Both Super Trend & Pivot HL indicate a highly probable Bullish continuation.
Target - 4.073
Recommended Stop Loss - 3.667
About Used Indicators:
A pivot point is a technical analysis indicator, or calculations, used to determine the overall trend of the market over different time frames.
———————————
WISH YOU ALL LUCK

Gold | Oil | Dollar | Silver | Natural Gas Price ForecastTVC:GOLD | MARKETSCOM:OIL | NSE:DOLLAR | TVC:SILVER | Natural Gas Price Forecast
Price action, pattern analysis, and price forecast

NATGAS: Bullish Continuation is Expected! Here is Why:
Our strategy, polished by years of trial and error has helped us identify what seems to be a great trading opportunity and we are here to share it with you as the time is ripe for us to buy NATGAS.
❤️ Please, support our work with like & comment! ❤️

E-cutieAll year EQT, an unloved natural gas producer has been a swing trader's paradise. I've harvested so many gains from these E-cutie trees I thought I'd make a thread just for it and post trading updates.
The macro technical picture is clear. Years of being battered by shorts ended with capitulation in 2020, followed by a swift rebound. Fundamentals are tightening. According to analysts, $25 is fair price for $2.50 NG price. Goldman Sachs has a $23ish target. Price action is showing signs of bottoming. It's lining up but this is much more profitable short term swings.
Currently, price is building a base at previous long term support around $18. More downside is certainly a possibility given that NG prices look overvalued. But, EQT is in a channel and fundamentally undervalued. Investors might front run this sector as demand picks up in later in the year, in which EQT will likely be closer to $25.
s3.tradingview.com
Long EQT
+200 @ 18.10

NATGAS Risky Long! Buy!
Hello,Traders!
NATGAS is going now
But a strong horizontal
Support of 3.750$ so
After the retest we will be
Expecting a local bullish rebound
Buy!
Comment and subscribe to help us grow!
Check out other forecasts below too!

NATGAS Massive Short! SELL!
My dear subscribers,
My technical analysis for NATGAS is below:
The price is coiling around a solid key level - 4.257
Bias - Bearish
Technical Indicators: Pivot Points Low anticipates a potential price reversal.
Super trend shows a clear sell, giving a perfect indicators' convergence.
Goal - 3.892
My Stop Loss -4.468
About Used Indicators:
By the very nature of the supertrend indicator, it offers firm support and resistance levels for traders to enter and exit trades. Additionally, it also provides signals for setting stop losses
———————————
WISH YOU ALL LUCK

NATGAS: Short Trade with Entry/SL/TP
NATGAS
- Classic bearish setup
- Our team expects bearish continuation
SUGGESTED TRADE:
Swing Trade
Short NATGAS
Entry Point - 4.257
Stop Loss - 4.470
Take Profit - 3.881
Our Risk - 1%
Start protection of your profits from lower levels
❤️ Please, support our work with like & comment! ❤️

Gas Prices Catch Fire: 25-Month High Reached Amid Winter's FuryNatural gas futures have reached a 25-month high, marking a significant price increase.
This surge is attributed to two primary factors:
1. Cold Weather: Unusually cold temperatures in key regions have increased demand for natural gas, as it is a primary source of heating.
2. Supply Disruptions: Issues in natural gas production or distribution have tightened supply, further driving up prices.
◉ Technical Observations
● After breaking out of the Inverted Head & Shoulders pattern, the price soared to $4.350.
● Subsequently, the price faced a significant pullback to around the $3.30 mark.
● However, the price rebounded from this point and is now at a 25-month high, with expectations for continued growth.
