Nat Gas: Trading the WeatherNYMEX: Micro Henry Hub Natural Gas Futures ( CME_MINI:MNQ1! )
On December 31, 2024, the lead contract of NYMEX Henry Hub Natural Gas futures closed at $3.6330 per MMBtu. This marked a strong gain of 44.5% year-over-year, making it the best performing active futures contract for the year.
Nat Gas is one of the most actively traded commodities. According to CME Group:
• Henry Hub booked record trading volume in 2024. Average daily volumes for futures and options were 566,000 and 242,000 contracts, respectively.
• As of last Friday, Open Interests were 1,511,978 for futures and 775,176 for options.
The Basic
Natural gas is a leading energy source for global economy. While clean energy generates a lot of buzz these days, natural gas still carries the biggest load in power generation. The U.S. Energy Information Administration (EIA) estimates U.S. electricity production at 4.18 trillion kilowatt-hours in 2023.
• About 43.1% of the electricity was generated by natural gas.
• Nuclear power contributed to 18.6%, while coal had a 16.2% share.
• Combined, Renewables accounted for a 21.4% share, including 10.2% from Wind, 5.7% from Hydro, and 3.9% from Solar.
The price of a commodity is determined by its supply and demand. In the case of electricity, it is hard to store while its demand is highly unpredictable. New storage technology is limited by capacity and high cost. With Nat Gas being the biggest energy source, unforeseen changes in power demand could send shock waves into the market.
Weather factors, in particular temperature, have the biggest impact in power demand.
• In the summer months, the biggest power usage is for air conditioning cooling. Cooling Degree Day (CDD) is the number of days in a month where the average daily temperature is above 68 degrees Fahrenheit.
• In the winter months, the biggest power usage is for heating home and offices. Heating Degree Day (HDD) is the number of days in a month where the average daily temperature is below 68 degrees Fahrenheit.
Energy traders deploy CDD/HDD analysis and weather forecast models to predict temperature trends, electricity demand and the subsequent natural gas use.
The Weather Shocks
On December 29, 2024, the Weather Co. and Atmospheric G2 released a weather forecast for January showing colder than average temperature in the East, specifically from Florida to Maine as well as certain parts of the Great Lakes.
In a separate report, AccuWeather meteorologists said that the colder air could trigger a winter storm with substantial snow and ice for a significant portion of the month’s first half. They added that the drop will begin in the middle and latter part of next week.
When the futures market opened the next day, the price of Henry Hub futures surged 20%, hitting a new 52-week high of $4.20.
Earlier in the winter, Germany experienced the so-called “Dunkelflaute” with no wind and a clouded sky. This is the worst scenario for wind and solar power. As Germany is heavily reliant on renewable energy, when the weather fails to cooperate, its power supply drops by half, sending electricity prices sky high.
The huge supply gap prompted energy companies to turn on gas-fueled backup power plants, pushing the Dutch TTF ( NYMEX:TTF1! ) natural gas contracts to a record high.
At the time of this writing, severe winter storms are sweeping across the Central Plains in the U.S., bringing heavy snow, sleet, and frozen rain from Kansas to Missouri, Illinois, Indiana, Kentucky, Ohio and Washington, D.C. Apart from the winter hazards, I expect higher power consumption to keep people warm from the below-average temperatures.
Trading with Micro Henry Hub Futures
Micro Henry Hub natural gas futures (MNG) offer smaller-sized versions of CME Group’s liquid benchmark Henry Hub futures (NG) contracts. The Micro futures have a contract size of 1,000 MMBtu, which is 1/10th of the standard contract. The Micro contracts allow traders to control a large contract value with a small amount of capital.
With Friday settlement price of $3.354, each February contract (MNGG5) has a notional value of $3,354. Buying or selling one contract requires an initial margin of $366.
Since its Monday high, Henry Hub prices have plunged 20%. Subsequent updated weather forecasts now predicted warmer trends for the Eastern US, which could curb heating demand for Nat Gas. Losses accelerated last Friday after the EIA reported that Nat Gas inventories for the week of December 27th fell -116 bcf, a smaller draw than expectations of -128 bcf.
In my opinion, the draw was lower due to the reduced economic activity around the Christmas holiday. For the same token, we could see a smaller draw during the New Year. However, I consider this data seasonal outliners, rather than a longer-term trend.
Global warming doesn’t necessarily mean warmer winters. Higher global temperature brings moisture from the ocean, with wetter atmosphere generating more extreme weather events. I expect winter temperature patterns to shift to much colder-than-normal, with cool anomalies poised to stick around key population centers deep into the winter.
As we have seen in the past, unpredictable weather events could send large shocks to natural gas prices. With Micro Henry Hub contracts, traders could potentially realize sizable gains with a small capital requirement.
Hypothetically, if the February prices move up 10% to $3.689 with lower temperature forecasts, the $0.3354 price gain would translate into $335.4 for a long futures position, given the contract size at 1,000 MMBtu. Using the initial margin of $366 as a cost base, the trade would produce a theoretical return of 99.6% (=335.4/366).
The long futures position would lose money if Nat Gas prices continued to trend lower.
Happy Trading.
Disclaimers
*Trade ideas cited above are for illustration only, as an integral part of a case study to demonstrate the fundamental concepts in risk management under the market scenarios being discussed. They shall not be construed as investment recommendations or advice. Nor are they used to promote any specific products, or services.
CME Real-time Market Data help identify trading set-ups and express my market views. If you have futures in your trading portfolio, you can check out on CME Group data plans available that suit your trading needs www.tradingview.com
Natgas

Natural Gas | Oil | Dollar | Silver | Gold Price ForecastNatural Gas | Oil | Dollar | Silver | Gold Price Forecast

NATGAS // Can you imagine $1?This weekly candle looks bearish. It's even more bearish if we take into account that it was printed on the monthly impulse base.
It means that the monthly trend is still short, and if the weekly gets aligned, the price may target the last clean weekly breakout (red), where the countertrend line also breaks, and where the $1 for natural becomes a nice target.
Do you see it coming?
———
Orange lines represent impulse bases on major timeframes, signaling the direction and validity of the prevailing trend by acting as key levels where significant momentum originated.
Level colors:
Daily - blue
Weekly - purple
Monthly - magenta
H4 - aqua
Long trigger - green
Short trigger - red
———
Stay grounded, stay present. 🏄🏼♂️
<<please boost 🚀 if you enjoy💚

Natgas to take the top again.Natgas has filled FVG. let it consolidate for 8-10 hours. Look for buys to take the top once more.
4.5 is the next target

NatGAS is heating upA close above the white Center-Line projects higher prices to come.
There are 2 scenarios I see:
1. pull-back to the white CL, then up.
2. cross above the petrol CL, further and fast continuation to the north.
...oh, there's 3rd scenario:
3. price is getting punched back below the white Center-Line again. If that comes true, price has another chance to go south, with a target at the 1/4 line, or even way down to the L-MLH.

Copper breached the supportThe L-MLH is a most likely support.
This support is breached in Copper, and a fllow through would indicate way lower prices.
What I really like in this Chart is the tiny pullback to the L-MLH, since this is totally expected after a breach of it.
Arrows mark potential targets.

Bullish on Natural Gas - January 280 Call OptionSummary: I'm bullish on the Natural Gas January 280 call option. Here's my trade idea:
Current Price: Closed at ₹24.76 on December 27, 2024.
Entry:
Best Buying Price: Aim to enter below ₹18.80 for optimal risk-reward.
Target:
Price Target: Looking towards ₹37-₹40.
Rationale:
The current market conditions suggest potential for an upward movement in natural gas prices, supported by seasonal demand increases and possible geopolitical tensions affecting supply.
Technical analysis indicates a potential breakout if the price sustains above key support levels.
Risk Management:
Set a stop-loss just below ₹16 to minimize potential losses if the market moves against the position.
Position size should be managed to ensure the trade aligns with your risk tolerance.
Time Frame:
This trade is for the January expiry, giving us a tight window to capitalize on the expected price increase.
Disclaimer: This is not financial advice but a personal trading idea. Always do your own research and consider your financial situation before trading.
Let's see if we can catch that wave up to ₹37-₹40!

NATGAS My Opinion! SELL!
My dear friends,
NATGAS looks like it will make a good move, and here are the details:
The market is trading on 3.749 pivot level.
Bias - Bearish
Technical Indicators: Supper Trend generates a clear short signal while Pivot Point HL is currently determining the overall Bearish trend of the market.
Goal - 3.574
About Used Indicators:
Pivot points are a great way to identify areas of support and resistance, but they work best when combined with other kinds of technical analysis
———————————
WISH YOU ALL LUCK

NATGAS: Short Trade with Entry/SL/TP
NATGAS
- Classic bearish pattern
- Our team expects retracement
SUGGESTED TRADE:
Swing Trade
Sell NATGAS
Entry - 3.749
Stop - 3.948
Take - 3.376
Our Risk - 1%
Start protection of your profits from lower levels
❤️ Please, support our work with like & comment! ❤️

NATGAS momentum lossI can see natural gas loosing momentum and volume divergence. No more interested in buys. Look for sells only. I need the price to fill the Fair Value gap around 2.6. Trade with care risk only 1%.

At support Natgas is trading inside the channel with strict resistance at 3.4 If breaks, 4 dollars is in cards.

NATGAS: Bullish Continuation is Expected! Here is Why:
The charts are full of distraction, disturbance and are a graveyard of fear and greed which shall not cloud our judgement on the current state of affairs in the NATGAS pair price action which suggests a high likelihood of a coming move up.
❤️ Please, support our work with like & comment! ❤️

NATGAS Will Explode! BUY!
My dear followers,
I analysed this chart on NATGAS and concluded the following:
The market is trading on 3.268 pivot level.
Bias - Bullish
Technical Indicators: Both Super Trend & Pivot HL indicate a highly probable Bullish continuation.
Target - 3.355
About Used Indicators:
A super-trend indicator is plotted on either above or below the closing price to signal a buy or sell. The indicator changes color, based on whether or not you should be buying. If the super-trend indicator moves below the closing price, the indicator turns green, and it signals an entry point or points to buy.
———————————
WISH YOU ALL LUCK

Turbulent Times Ahead for Natural Gas MarketNatural gas prices began the week with a gap-up, driven by forecasts of colder weather increasing demand, but have since faced strong selling pressure, making traders cautious.
◉ Technical Analysis
● A bullish turnaround seems imminent for Natural Gas prices, highlighted by the appearance of an Inverted Head & Shoulder pattern on the daily chart.
● After breaking out, the price momentarily reached the $3.290 resistance level before retreating and revisiting the breakout point.
● The price is now attempting to breach the resistance zone again, with expectations of exceeding the level soon.
● However, a drop below $2.800 could trigger a further correction.
◉ Overall Outlook
Natural gas prices are poised for a volatile week as traders weigh colder weather expectations against bearish technical signals. Thursday's inventory data will be crucial in determining the next price move.

Natural gas is in the Selling directionHello Traders
In This Chart NATGAS HOURLY Forex Forecast By FOREX PLANET
today NATGAS analysis 👆
🟢This Chart includes_ (NATGAS market update)
🟢What is The Next Opportunity on NATGAS Market
🟢how to Enter to the Valid Entry With Assurance Profit
This CHART is For Trader's that Want to Improve Their Technical Analysis Skills and Their Trading By Understanding How To Analyze The Market Using Multiple Timeframes and Understanding The Bigger Picture on the Charts

NATGAS BULLISH BIAS|LONG|
✅NATGAS fell again to retest the support of 3.20$
But it is a strong key level
So I think that there is a high chance
That we will see a bullish rebound and a move up
LONG🚀
✅Like and subscribe to never miss a new idea!✅

NATGAS: Bearish Forecast & Outlook
The charts are full of distraction, disturbance and are a graveyard of fear and greed which shall not cloud our judgement on the current state of affairs in the NATGAS pair price action which suggests a high likelihood of a coming move down.
❤️ Please, support our work with like & comment! ❤️

NATGAS What Next? SELL!
My dear subscribers,
My technical analysis for NATGAS is below:
The price is coiling around a solid key level - 3.106
Bias - Bearish
Technical Indicators: Pivot Points Low anticipates a potential price reversal.
Super trend shows a clear sell, giving a perfect indicators' convergence.
Goal - 3.067
About Used Indicators:
By the very nature of the supertrend indicator, it offers firm support and resistance levels for traders to enter and exit trades. Additionally, it also provides signals for setting stop losses
———————————
WISH YOU ALL LUCK

NATGAS Will Grow! Buy!
Hello,Traders!
NATGAS made a retest of
The horizontal support level
Of 3.00$ and we are already
Seeing a local bullish rebound
So we will be expecting a
Further bullish move up
Buy!
Comment and subscribe to help us grow!
Check out other forecasts below too!

NATGAS BULLISH REBOUND AHEAD|LONG|
✅NATGAS will be retesting a support level of 3.128$ soon
From where I am expecting a bullish reaction
With the price going up but we need
To wait for a reversal pattern to form
Before entering the trade, so that we
Get a higher success probability of the trade
LONG🚀
✅Like and subscribe to never miss a new idea!✅

NATGAS Support Ahead! Buy!
Hello,Traders!
NATGAS is going down to
Retest the horizontal support
Of 3.09$ and as we are
Locally bullish biased
We will be expecting a
Local bullish rebound
Buy!
Comment and subscribe to help us grow!
Check out other forecasts below too!

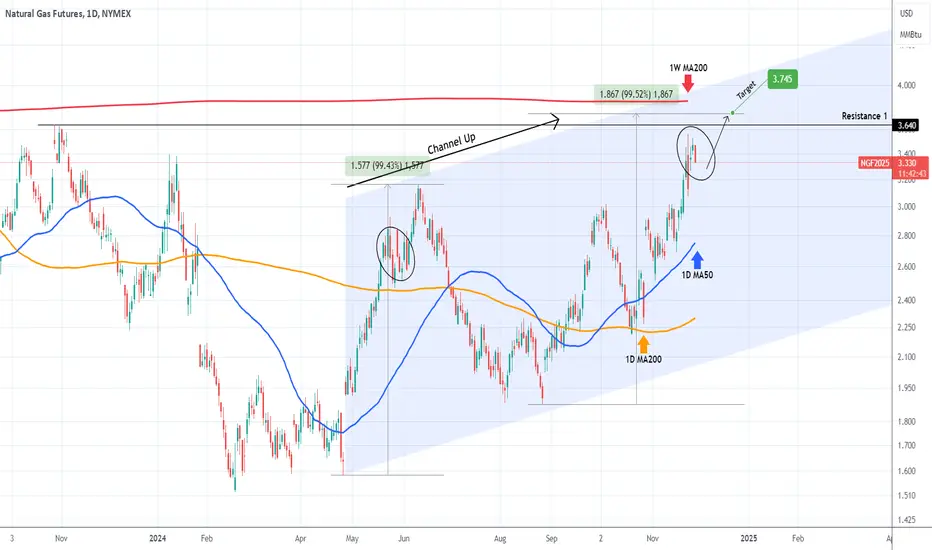
NATURAL GAS Final push before peakingNatural Gas (NG1!) rose and hit our 2.900 Target called on our last analysis (August 29, see chart below) and after a pull-back, broke above the Triangle:
The Triangle transitioned to a Channel Up and the price is already near the end of its Bullish Leg. The 1W MA200 (red trend-line) is the long-term Resistance (untouched since January 17 2023) so only above it can we justify a new bullish trend.
Until then, our Target is 3.745, which represents a +99.50% rise from the last Higher Low, which is the same % rise as the first Bullish Leg of the Channel Up.
-------------------------------------------------------------------------------
** Please LIKE 👍, FOLLOW ✅, SHARE 🙌 and COMMENT ✍ if you enjoy this idea! Also share your ideas and charts in the comments section below! This is best way to keep it relevant, support us, keep the content here free and allow the idea to reach as many people as possible. **
-------------------------------------------------------------------------------
💸💸💸💸💸💸
👇 👇 👇 👇 👇 👇
NATGAS SHORT FROM RESISTANCE|
✅NATGAS is going up now
But a strong resistance level is ahead of 3.646$
Thus I am expecting a pullback
And a move down towards the target at 3.300$
SHORT🔥
✅Like and subscribe to never miss a new idea!✅
