Natural gas is in the Selling direction Hello Traders
In This Chart NATGAS HOURLY Forex Forecast By FOREX PLANET
today NATGAS analysis 👆
🟢This Chart includes_ (NATGAS market update)
🟢What is The Next Opportunity on NATGAS Market
🟢how to Enter to the Valid Entry With Assurance Profit
This CHART is For Trader's that Want to Improve Their Technical Analysis Skills and Their Trading By Understanding How To Analyze The Market Using Multiple Timeframes and Understanding The Bigger Picture on the Charts
Natgas

NATGAS REBOUND AHEAD|LONG|
✅NATGAS is approaching a demand level around 3.00$
So according to our strategy
We will be looking for the signs of the reversal in the trend
To jump onto the bearish bandwagon just on time to get the best
Risk reward ratio for us
LONG🚀
✅Like and subscribe to never miss a new idea!✅

NATGAS Set To Fall! SELL!
My dear friends,
My technical analysis for NATGAS is below:
The market is trading on 3.122 pivot level.
Bias - Bearish
Technical Indicators: Both Super Trend & Pivot HL indicate a highly probable Bearish continuation.
Target - 2.910
Recommended Stop Loss - 3.241
About Used Indicators:
A pivot point is a technical analysis indicator, or calculations, used to determine the overall trend of the market over different time frames.
———————————
WISH YOU ALL LUCK

NATGAS BULLISH BREAKOUT|LONG|
✅NATGAS is trading in an
Uptrend and we are seeing
A bullish breakout which
Makes us bullish biased and
We will be expecting a
Further move up
LONG🚀
✅Like and subscribe to never miss a new idea!✅

NATGAS Risky Short! Sell!
Hello,Traders!
NATGAS is about to retest
A horizontal resistance
Of 3.024$ from where
We will be expecting
A local bearish correction
Sell!
Like, comment and subscribe to help us grow!
Check out other forecasts below too!

NATGAS Set To Fall! SELL!
My dear friends,
Please, find my technical outlook for NATGAS below:
The price is coiling around a solid key level -2.837
Bias - Bearish
Technical Indicators: Pivot Points Low anticipates a potential price reversal.
Super trend shows a clear sell, giving a perfect indicators' convergence.
Goal - 2.760
About Used Indicators:
The pivot point itself is simply the average of the high, low and closing prices from the previous trading day.
———————————
WISH YOU ALL LUCK

NATGAS: Bears Will Push
Balance of buyers and sellers on the NATGAS pair, that is best felt when all the timeframes are analyzed properly is shifting in favor of the sellers, therefore is it only natural that we go short on the pair.
❤️ Please, support our work with like & comment! ❤️

NATGAS Set To Grow! BUY!
My dear followers,
I analysed this chart on NATGAS and concluded the following:
The market is trading on 2.665 pivot level.
Bias - Bullish
Technical Indicators: Both Super Trend & Pivot HL indicate a highly probable Bullish continuation.
Target - 2.739
About Used Indicators:
A super-trend indicator is plotted on either above or below the closing price to signal a buy or sell. The indicator changes color, based on whether or not you should be buying. If the super-trend indicator moves below the closing price, the indicator turns green, and it signals an entry point or points to buy.
———————————
WISH YOU ALL LUCK

Natural Gas Oil, Dollar, Silver, Gold Price ForecastNatural Gas stock Bulls
Gold OANDA:XAUUSD Stock Forecast
Silver OANDA:XAGUSD

Natural Gas still coiling! breakdown or breakout? Hello Traders
In This Chart NATGAS HOURLY Forex Forecast By FOREX PLANET
today NATGAS analysis 👆
🟢This Chart includes_ (NATGAS market update)
🟢What is The Next Opportunity on NATGAS Market
🟢how to Enter to the Valid Entry With Assurance Profit
This CHART is For Trader's that Want to Improve Their Technical Analysis Skills and Their Trading By Understanding How To Analyze The Market Using Multiple Timeframes and Understanding The Bigger Picture on the Charts

NATGAS: Bullish Continuation is Expected! Here is Why:
Our strategy, polished by years of trial and error has helped us identify what seems to be a great trading opportunity and we are here to share it with you as the time is ripe for us to buy NATGAS.
❤️ Please, support our work with like & comment! ❤️

NG, prepping for a multi weekly gain come December 2023NG based on monthly data is registering very significant net buy volume at the current price range.
Seller's strength is certainly fading out based on thinning price volatility this past few days / weeks -- as shown on yellow price lines on chart.
NG is currently sitting at a strong major support at 2.0 to 2.5 area, a 1.0 FIB discount level -- this is where most buyers converge.
Initial trend shift has been spotted at the present price range.
Spotted at 2.50
TAYOR
Safeguard capital always.

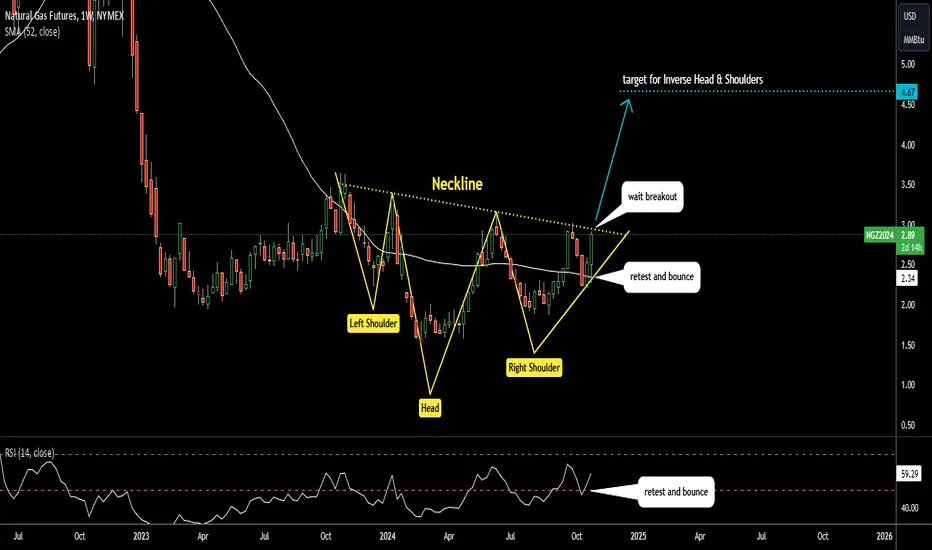
Natural Gas: Inverse Head & Shoulders targets $4.67The series of three valleys with the lowest bottom in between shaped notorious Inverse Head & Shoulders pattern in Natural Gas futures chart.
It's bullish reversal pattern.
Price eyes to break above the Neckline to trigger the pattern.
Target is located at the size of the Head added to the Neckline break point at $4.67.
Invalidation is below the trough of Right Shoulder at $1.88
Indicators support this bullish pattern:
1) RSI retested the midline and bounced up
2) Price retested 52-week MA and bounced up
NATGAS The Target Is DOWN! SELL!
My dear followers,
I analysed this chart on NATGAS and concluded the following:
The market is trading on 2.525pivot level.
Bias - Bearish
Technical Indicators: Both Super Trend & Pivot HL indicate a highly probable Bearish continuation.
Target - 2.384
About Used Indicators:
A super-trend indicator is plotted on either above or below the closing price to signal a buy or sell. The indicator changes color, based on whether or not you should be buying. If the super-trend indicator moves below the closing price, the indicator turns green, and it signals an entry point or points to buy.
———————————
WISH YOU ALL LUCK

Natural Gas still coiling! breakdown or breakout?Hello Traders
In This Chart NATGAS HOURLY Forex Forecast By FOREX PLANET
today NATGAS analysis 👆
🟢This Chart includes_ (NATGAS market update)
🟢What is The Next Opportunity on NATGAS Market
🟢how to Enter to the Valid Entry With Assurance Profit
This CHART is For Trader's that Want to Improve Their Technical Analysis Skills and Their Trading By Understanding How To Analyze The Market Using Multiple Timeframes and Understanding The Bigger Picture on the Charts
NATGAS: Bears Will Push
The charts are full of distraction, disturbance and are a graveyard of fear and greed which shall not cloud our judgement on the current state of affairs in the NATGAS pair price action which suggests a high likelihood of a coming move down.
❤️ Please, support our work with like & comment! ❤️

NATGAS RESISTANCE AHEAD|SHORT|
✅NATGAS is going up now
But a strong resistance level is ahead at 2.55$
Thus I am expecting a pullback
And a move down towards the target at 2.40$
SHORT🔥
✅Like and subscribe to never miss a new idea!✅

NATGAS Local Risky Long! Buy!
Hello,Traders!
NATGAS has hit a horizontal
Support level of 2.20$ from
Where we are seeing a bullish
Rebound and we will be
Expecting a further move up
Buy!
Like, comment and subscribe to help us grow!
Check out other forecasts below too!

NATGAS RISKY LONG|
✅NATGAS retested the strong support level of 2.215$
After trading in a local downtrend from some time
Which makes a bullish rebound a likely scenario
With the target being a local resistance above at 2.331$
LONG🚀
✅Like and subscribe to never miss a new idea!✅

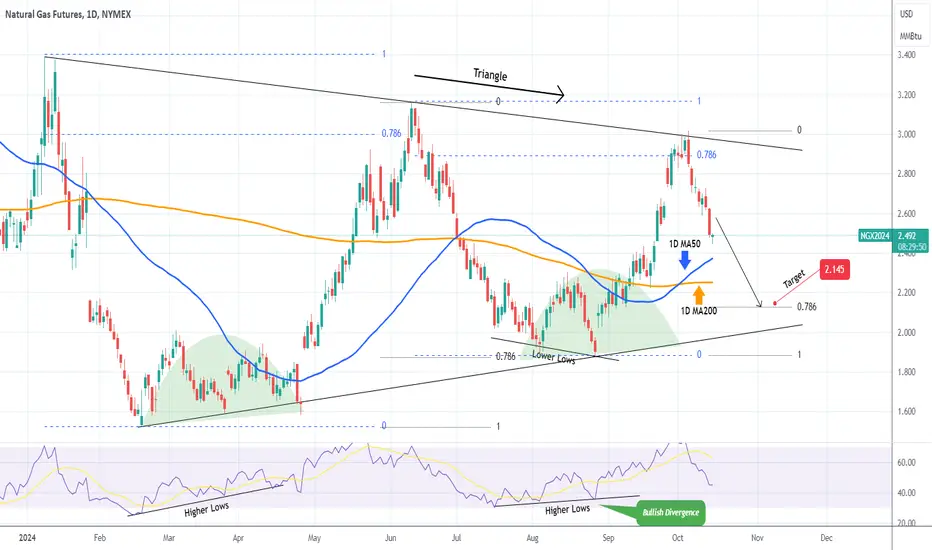
NATURAL GAS on a Bearish Leg. Still a sell signal.Natural Gas (NG1!) gave us an excellent buy opportunity last time (August 29, see chart below) and easily hit our 2.900 Target:
Once it hit the 0.786 Fibonacci retracement level (blue) it formed a Lower High at the top of the Triangle pattern and got rejected. The previous Lower High rejection that started the Bearish Leg, bottomed on the Higher Lows trend-line of the Triangle on the 0.786 Fib (black trend-line).
As a result we remain bearish on NG, targeting 2.145 (0.786 Fib).
-------------------------------------------------------------------------------
** Please LIKE 👍, FOLLOW ✅, SHARE 🙌 and COMMENT ✍ if you enjoy this idea! Also share your ideas and charts in the comments section below! This is best way to keep it relevant, support us, keep the content here free and allow the idea to reach as many people as possible. **
-------------------------------------------------------------------------------
💸💸💸💸💸💸
👇 👇 👇 👇 👇 👇
NATGAS_4Hhello
Natural gas analysis Analysis based on Elliott waves The market is forming wave 4 of correction. The bottom of wave 4 can be considered the range of 2.700 and by maintaining the high price of this number, it can form an upward wave. The target of wave 5 can be considered as 3.333.

NATGAS: Long Signal Explained
NATGAS
- Classic bullish setup
- Our team expects bullish continuation
SUGGESTED TRADE:
Swing Trade
Long NATGAS
Entry Point - 2.628
Stop Loss - 2.519
Take Profit - 2.824
Our Risk - 1%
Start protection of your profits from lower levels
❤️ Please, support our work with like & comment! ❤️

NATGAS Sellers In Panic! BUY!
My dear followers,
I analysed this chart on NATGAS and concluded the following:
The market is trading on 2.628 pivot level.
Bias - Bullish
Technical Indicators: Both Super Trend & Pivot HL indicate a highly probable Bullish continuation.
Target - 2.778
Safe Stop Loss - 2.529
About Used Indicators:
A super-trend indicator is plotted on either above or below the closing price to signal a buy or sell. The indicator changes color, based on whether or not you should be buying. If the super-trend indicator moves below the closing price, the indicator turns green, and it signals an entry point or points to buy.
———————————
WISH YOU ALL LUCK
