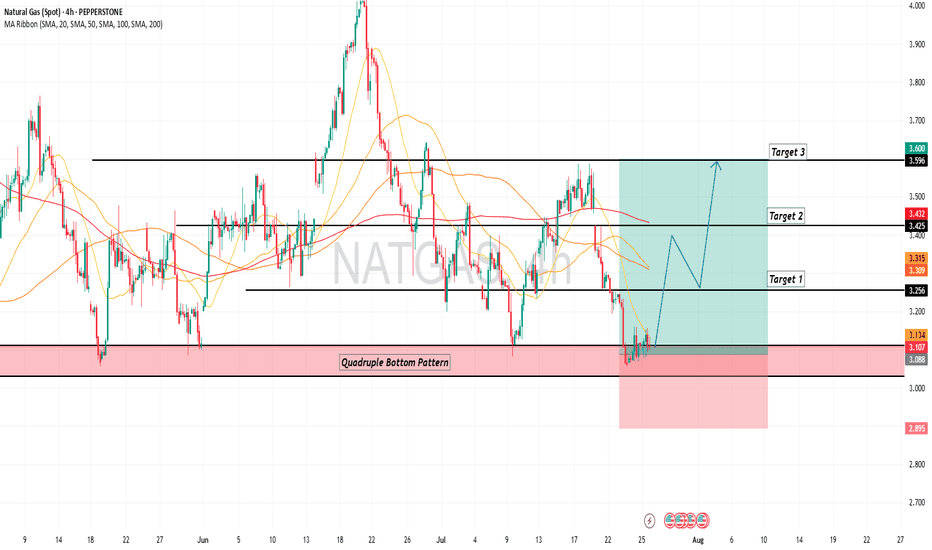
Natural Gas is in the Buying DirectionHello Traders
In This Chart NATGAS HOURLY Forex Forecast By FOREX PLANET
today NATGAS analysis 👆
🟢This Chart includes_ (NATGAS market update)
🟢What is The Next Opportunity on NATGAS Market
🟢how to Enter to the Valid Entry With Assurance Profit
This CHART is For Trader's that Want to Improve Their Technical Analysis Skills and Their Trading By Understanding How To Analyze The Market Using Multiple Timeframes and Understanding The Bigger Picture on the Charts
Natgaslong
Natural Gas is in the Buying DirectionHello Traders
In This Chart NATGAS HOURLY Forex Forecast By FOREX PLANET
today NATGAS analysis 👆
🟢This Chart includes_ (NATGAS market update)
🟢What is The Next Opportunity on NATGAS Market
🟢how to Enter to the Valid Entry With Assurance Profit
This CHART is For Trader's that Want to Improve Their Technical Analysis Skills and Their Trading By Understanding How To Analyze The Market Using Multiple Timeframes and Understanding The Bigger Picture on the Charts
Natural Gas is in the Buying Direction After Trendline Breakout Hello Traders
In This Chart NATGAS HOURLY Forex Forecast By FOREX PLANET
today NATGAS analysis 👆
🟢This Chart includes_ (NATGAS market update)
🟢What is The Next Opportunity on NATGAS Market
🟢how to Enter to the Valid Entry With Assurance Profit
This CHART is For Trader's that Want to Improve Their Technical Analysis Skills and Their Trading By Understanding How To Analyze The Market Using Multiple Timeframes and Understanding The Bigger Picture on the Charts
Natural Gas is in the Buying DirectionHello Traders
In This Chart NATGAS HOURLY Forex Forecast By FOREX PLANET
today NATGAS analysis 👆
🟢This Chart includes_ (NATGAS market update)
🟢What is The Next Opportunity on NATGAS Market
🟢how to Enter to the Valid Entry With Assurance Profit
This CHART is For Trader's that Want to Improve Their Technical Analysis Skills and Their Trading By Understanding How To Analyze The Market Using Multiple Timeframes and Understanding The Bigger Picture on the Charts
Natural Gas is in the Buy DirectionHello Traders
In This Chart NATGAS HOURLY Forex Forecast By FOREX PLANET
today NATGAS analysis 👆
🟢This Chart includes_ (NATGAS market update)
🟢What is The Next Opportunity on NATGAS Market
🟢how to Enter to the Valid Entry With Assurance Profit
This CHART is For Trader's that Want to Improve Their Technical Analysis Skills and Their Trading By Understanding How To Analyze The Market Using Multiple Timeframes and Understanding The Bigger Picture on the Charts
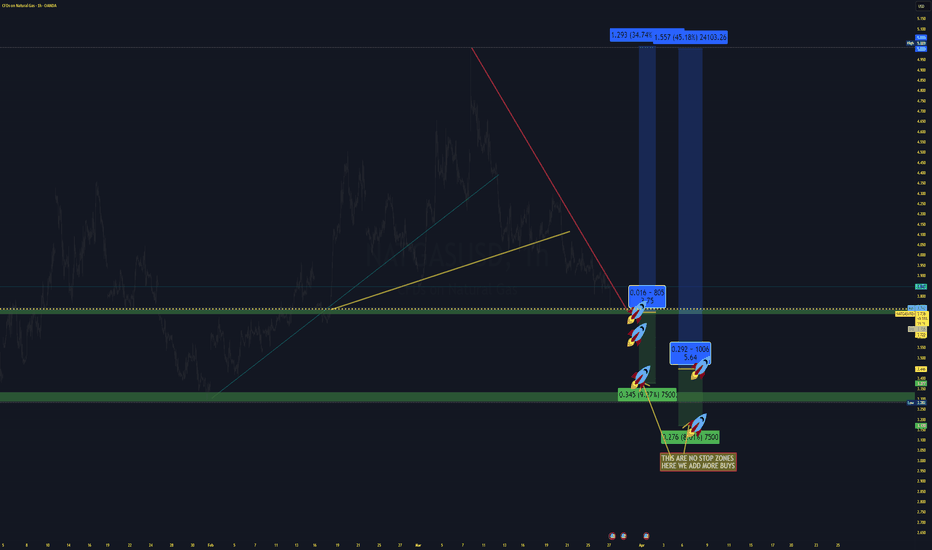
NatGas Natural Gas LongPresident Trump´s tariffs on Russia, energy crisis ,and natgas cycle starting to motivate more buyers accumulationg their positions,going for higher prices.
Technically a profit taking time of the bulls is coming to an end.
Rockets:Buy/add more buys
2 variants:For more conservative traders, and those who have higher risk appetite.
Profit targets are the same.
The entries of both apporoaches are near and closed to strong midterm supports, therefor I have already taken this trades,as they promissing lower risk to me
NatGAS is heating upA close above the white Center-Line projects higher prices to come.
There are 2 scenarios I see:
1. pull-back to the white CL, then up.
2. cross above the petrol CL, further and fast continuation to the north.
...oh, there's 3rd scenario:
3. price is getting punched back below the white Center-Line again. If that comes true, price has another chance to go south, with a target at the 1/4 line, or even way down to the L-MLH.
Natural gas is in the Selling direction Hello Traders
In This Chart NATGAS HOURLY Forex Forecast By FOREX PLANET
today NATGAS analysis 👆
🟢This Chart includes_ (NATGAS market update)
🟢What is The Next Opportunity on NATGAS Market
🟢how to Enter to the Valid Entry With Assurance Profit
This CHART is For Trader's that Want to Improve Their Technical Analysis Skills and Their Trading By Understanding How To Analyze The Market Using Multiple Timeframes and Understanding The Bigger Picture on the Charts
Natural Gas still coiling! breakdown or breakout?Hello Traders
In This Chart NATGAS HOURLY Forex Forecast By FOREX PLANET
today NATGAS analysis 👆
🟢This Chart includes_ (NATGAS market update)
🟢What is The Next Opportunity on NATGAS Market
🟢how to Enter to the Valid Entry With Assurance Profit
This CHART is For Trader's that Want to Improve Their Technical Analysis Skills and Their Trading By Understanding How To Analyze The Market Using Multiple Timeframes and Understanding The Bigger Picture on the Charts
Natural Gas still coiling! breakdown or breakout? Hello Traders
In This Chart NATGAS HOURLY Forex Forecast By FOREX PLANET
today NATGAS analysis 👆
🟢This Chart includes_ (NATGAS market update)
🟢What is The Next Opportunity on NATGAS Market
🟢how to Enter to the Valid Entry With Assurance Profit
This CHART is For Trader's that Want to Improve Their Technical Analysis Skills and Their Trading By Understanding How To Analyze The Market Using Multiple Timeframes and Understanding The Bigger Picture on the Charts
NATGAS LONG TERM TRADE analysHello Traders
In This Chart NATGAS HOURLY Forex Forecast By FOREX PLANET
today NATGAS analysis 👆
🟢This Chart includes_ (NATGAS market update)
🟢What is The Next Opportunity on NATGAS Market
🟢how to Enter to the Valid Entry With Assurance Profit
This CHART is For Trader's that Want to Improve Their Technical Analysis Skills and Their Trading By Understanding How To Analyze The Market Using Multiple Timeframes and Understanding The Bigger Picture on the Charts
NATURAL GAS - Only Way Is Up!From a technical standpoint, Natural Gas is currently at levels where there's very very limited downside and major potential for upside.
Many times when we've seen prices come to these lows, price shot up hundreds of %. It's unlikely that we'll hit 0 and therefore balance of probability suggests that going Long on Natural Gas would be a good bet!
Trade Idea:
- For a safe entry, enter on break of the red trendline
- For a risk entry, look for buying opportunities anywhere between the region of 1.6 and 1.8
- stops below lows after the red trendline breaks
- Targets: 3.5, 6, 10
Goodluck and as always, trade safe!
Natural Gas Trend Continuation LONGNot a market we trade super often, but there has obviously been a LOT of opportunity in natural gas as of late. After a long period of accumulation, NG has finally broken out to the upside. We are looking for potential trend continuation longs. Ideally, we would like to enter this trade around the ~3.00 level (roughly coincides with Anchored VWAP + support/resistance “flip zone”), but it may be a bit before NG trades back to those prices (if it does). However, shorter-term/more aggressive entries exist via demand zones circa 3.2. We’ve formed new/”fresh” 60-minute supply @ 3.346-3.380, so that is an upside target. One should drill down via smaller timeframes (30/20/15-minute), though, to see what additional supply zones form between ~3.2 and 3.346 – it’s likely other sell levels will exist within expanded range candlesticks formed earlier this morning (EST). Smaller timeframe supply zones + any resistance levels should serve as profit targets for longs; if you enter a trade with multiple contracts, you can always hold a runner and look for new highs if upside momentum is strong. Finally, keep in mind seasonality. We are doing a more thorough analysis here, but NG tends to catch a tailwind during colder months (vs. summer)... We’ll keep an eye on this market and will provide updates accordingly. As is always the case with trading, our approach/thesis could change as price action unfolds, so use your discretion when evaluating this idea. Questions/comments welcome!
Jon @ LionHart Trading
NATGAS LONG TERM TRADE analysisHello Traders
In This Chart NATGAS HOURLY Forex Forecast By FOREX PLANET
today NATGAS analysis 👆
🟢This Chart includes_ (NATGAS market update)
🟢What is The Next Opportunity on NATGAS Market
🟢how to Enter to the Valid Entry With Assurance Profit
This CHART is For Trader's that Want to Improve Their Technical Analysis Skills and Their Trading By Understanding How To Analyze The Market Using Multiple Timeframes and Understanding The Bigger Picture on the Charts
NATGAS LONG TERM TRADEBUYINGHello Traders
In This Chart NATGAS HOURLY Forex Forecast By FOREX PLANET
today NATGAS analysis 👆
🟢This Chart includes_ (NATGAS market update)
🟢What is The Next Opportunity on NATGAS Market
🟢how to Enter to the Valid Entry With Assurance Profit
This CHART is For Trader's that Want to Improve Their Technical Analysis Skills and Their Trading By Understanding How To Analyze The Market Using Multiple Timeframes and Understanding The Bigger Picture on the Charts
NATGAS Analysis 30July2023This analysis is still with the old analysis. Still in a positive condition bullish. After the price forms a choch structure and corrected, the price is stuck in the Fibo Retracement area 0.382 and is likely to continue bullish up to the right level of Fibo 1,618 in contact with the highest price in March.


