NATURAL GAS

One more low expected b4 a quick reversal in NaturalGas NatgasOne more low expected b4 a quick reversal in NaturalGas Natgas ,waiting for divergence for a buying entry...happy and safe trading..!!!

erikdobra | NATGAS SPACE-X- OF MUSK | Natural gas has had a drop above 500 pips from the top of the price at 2,000 this and because we have had a big drop in its interest in buying because of coronavirus, investors are demanding to have a stability above the price of 1,500 where can reduce the rate of production and increase demand while this would work quite well and in raising the price in the previous situation


NATGASUSDbeen watching this again and this looks to be making a deeper correction here we can see the pattern that's forming now can this be the last push to the downside ? lets see how we play out looks good more than happy taking trades like this


NATGASUSD - building upI'll invest part of budget in NATGAS in this year.
Let's see how low it will come again, below/around 1.60 I'll start adding bigger chunks, aiming for 2.00 - 2.10 for starters and looking for new entries if it will break above and pullback.
Monthly chart:
Disclaimer: this idea is solely for my own purposes, to satisfy the ego, if it will work out ;)


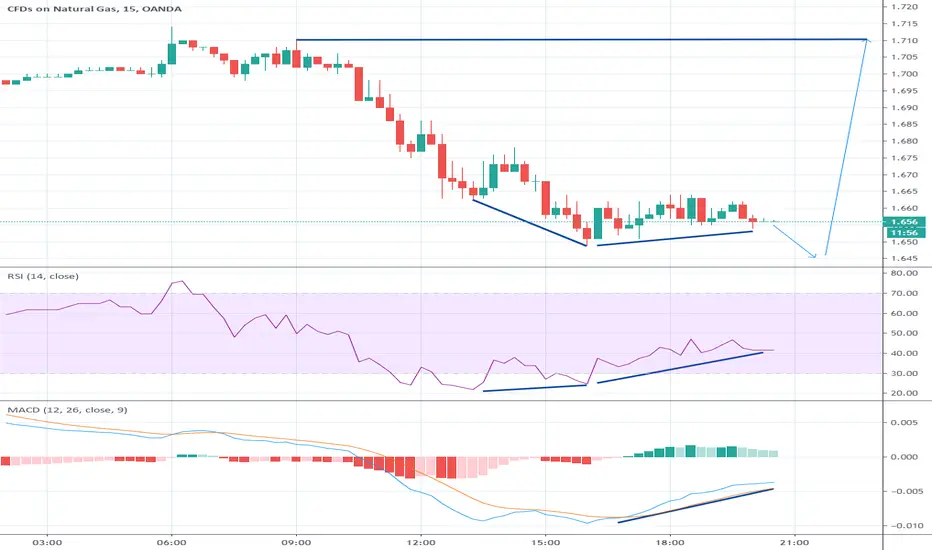
Naturalgas NatGas looking for one more low & a quick bounceWaiting for one more low with a divergence in MACD and RSI both to get a quick bounce.. Happy and Safe trading.
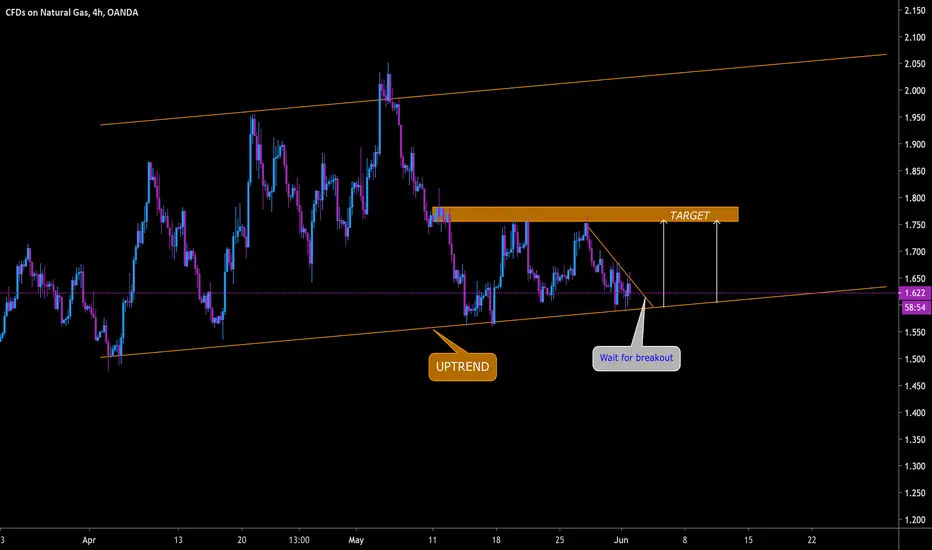
Trading the Range on NatGas by ThinkingAntsOkMain items we can see on the 4hs chart:
a) The price is inside a Huge 4HS range
b) Both sides have been tested multiple times
c) Currently, we can see a corrective Structure in the middle of the range after bouncing from the lower zone
d) If the Corrective Structure is broken with a bullish movement, we expect a continuation of it towards the Resistance zone
e) TRADING OPPORTUNITIES: Wait for the Breakout and look for 1h corrections

NATURAL GAS --> WATCH FOR TRIANGLE BREAK OUTWacht for triangle break out up or down -> targets clear

There is a trading opportunity to buy in NATGASMidterm forecast:
. While the price is above the support 1.550, beginning of uptrend is expected.
. We make sure when the resistance at 2.250 breaks.
. If the support at 1.550 is broken, the short-term forecast -beginning of uptrend- will be invalid.
Technical analysis:
. While the RSI downtrend #1 is not broken, bearish wave in price would continue.
. A peak is formed in daily chart at 2.024 on 05/20/2020, so more losses to support(s) 1.800, 1.700 and minimum to Major Support (1.550) is expected.
. Price is below WEMA21, if price rises more, this line can act as dynamic resistance against more gains.
. Relative strength index (RSI) is 47.
Trading suggestion:
. There is a possibility of temporary retracement to suggested support zone (1.800 to 1.700). if so, traders can set orders based on Price Action and expect to reach short-term targets.
Beginning of entry zone (1.800)
Ending of entry zone (1.700)
Take Profits:
TP1= 1.900
TP2= 2.000
TP3= 2.100
TP4= 2.250
TP5= 2.500
TP6= 2.700
TP7= 2.950
TP8= 3.350
TP9= 3.700
TP10= Free
❤️ If you find this helpful and want more FREE forecasts in TradingView
. . . . . Please show your support back,
. . . . . . . . Hit the 👍 LIKE button,
. . . . . . . . . . . Drop some feedback below in the comment!
❤️ Your Support is very much 🙏 appreciated! ❤️
💎 Want us to help you become a better Forex trader?
Now, It's your turn!
Be sure to leave a comment let us know how do you see this opportunity and forecast.
Trade well, ❤️
ForecastCity English Support Team ❤️

NATURAL GAS EXTREMELY BULLISHNATGAS is setting the stage for a potential double bottom. Price is currently resting at previous low, and has also tapped a multi year trendline.

Our Trading Plan on NATGAS by ThinkingAntsOkMain items we can see on the chart:
a) The price is on a well-tested support zone
b) The price has broken the descending trendline
c) We want to see a clear impulse outside the previous descending trendline + a 10-12 days correction
d) The reason we have decided that filter is because we observed similar behavior on the Weekly Chart in previous situations
WEEKLY CHART:


NATGASUSD BUYHello Traders 👋If you find this analysis useful, please support me with your likes and comments.
If you have another analysis at this pair, please share in comments, I will be glad to discuss with you.
Nat Gas is entering the bottom of the channel in which I beli...Nat Gas is entering the bottom of the channel in which I believe it will trade in in the next 14 days... 1.8 to 2.06


natural gas buy the dip - dogalgaz dipten alimnatural gas might be in a dip and good opportunity to buy, it will be a long run and we can look at adding up everytime it goes down
dogalgaz dipte olabilir ve guzel bir alim pozisyonu icin firsat vermis olabilir. Bu, uzun soluklu bir trade olacak ve her dususte ekleyerek pozisyon artirilarak gidilmesi lazim.
Not a financial advice, yatirim tavsiyesi degildir...

Natural Gas Likely Trading range for the next 14 daysThere is a high probability that Nat Gas will trade in this range over the next two weeks. What are your thoughts??


Weekly Analysis on NATGAS by ThinkingAntsOkMain items we can see on the chart:
a) The price is on a major Support zone
b) The price is on the process of breaking the descending trendline
c) If that happens (Weekly candlestick closing above the descending trendline) That will be our first filter to know that a possible bullish movement is coming
d) After that we will wait for a similar correction like the previous ones we saw on the two past bearish trends
e) If that happens, we will develop long setups.
