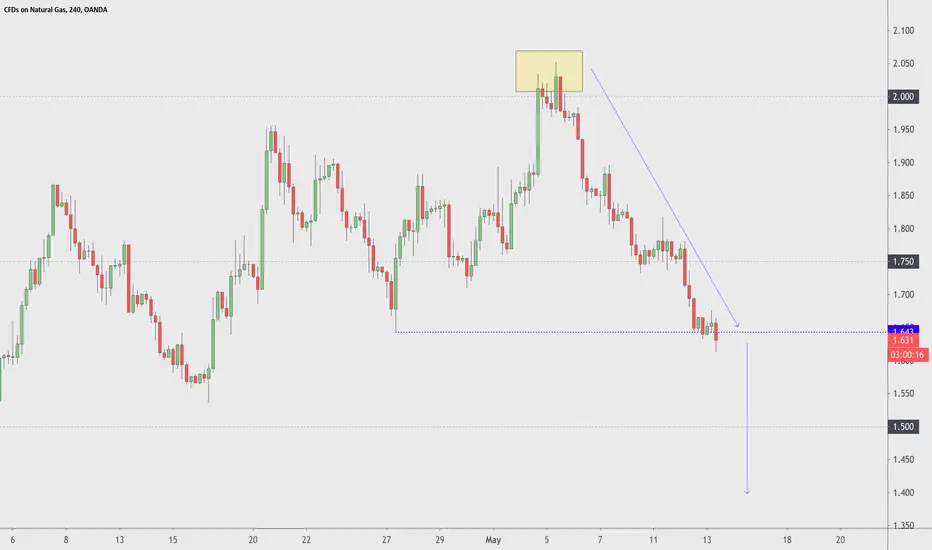
NATGASUSD is close to Buy Zone!I see a short term trade near the Support/Resistance Zone.
If the price will cross the zone we can open buy position to the next level.
Potential profit will be 3 times bigger than the risk.
Push like if you think this is a useful idea!
Before to trade my ideas make your own analysis.
Write your comments and questions here!
Thanks for your support!
NATURAL GAS


NATGAS lots of bearish sentiment but watch for the hot summer buNATGAS just keeps getting hit with more bearish news - storage and weather, with nothing supporting a bullish rally. That said, possible large upside once news of extended hot temps hit, and the concern over storage filling is passed. Storage filling up aside, downside may be limited just by the actual physical price going into a potentially very hot summer.

Will Natural Gas See Negative Rates? | NATURAL GAS ($NATURALGAS)✨ Drop a comment asking for an update, we do NEW setups every day! ✨
Like, Comment & Follow to help the community grow 🎉🎉
---
Natural gas demand hasn't fallen as much as oil, but a 2% decrease in demand (compared to oil's 6%), and already dwindling storage issues due to production not being curved enough and a warmer than normal winter, could have natural gas suffering the same fate as oil. That fate being temporary negative prices, due to a lack of storage, due to decreased demand, at least partially from COVID. With all of that in mind, even if this doesn't come to pass, the fear of it could drive prices lower. We don't want to short the bottom, but as we learned from oil, there is a scenario in which there is no bottom when it comes to expiring futures and a lack of storage. Still, the idea for today isn't a trade, it is mapping out some long term levels to keep in mind for whichever way price does move.
Resource: oilprice.com + www.naturalgasintel.com
---
Fractal Trend is showing a downtrend (Maroon bar color) on the 3 day timeframe. This represents the longterm downtrend in natural gas.
Typically in a downtrend we are looking for short positions. With that said, natural gas's historic volatility could certainly produce some nice long setups on smaller timeframes if one of the support levels noted on the chart holds.
To the downside S1 - S4 represent supports of last resort for nat gas bulls. IF these levels are breached, we could be looking at negative rates for natural gas. Meanwhile, if demand picks up and storage becomes less of an issue, or if prices move up for any reason, then R1 - R3 present logical spots to look for reactions. Any volatile move from natural gas would be nice to capture, so we'll be keeping a close eye on all these levels, and specifically will have our interest piqued if S4 can't hold and we run into more supply/demand issues for natural gas itself.


NATURAL GAS FUTURES (NG1!) Monthly, Weekly, DailyDates in the future with the greatest probability for a price high or price low.
The Djinn Predictive Indicators are simple mathematical equations. Once an equation is given to Siri the algorithm provides the future price swing date. Djinn Indicators work on all charts, for any asset category and in all time frames. Occasionally a Djinn Predictive Indicator will miss its prediction date by one candlestick. If multiple Djinn prediction dates are missed and are plowed through by same color Henikin Ashi candles the asset is being "reset". The "reset" is complete when Henikin Ashi candles are back in sync with Djinn price high or low prediction dates.
One way the Djinn Indicator is used to enter and exit trades:
For best results trade in the direction of the trend.
The Linear Regression channel is used to determine trend direction. The Linear Regression is set at 2 -2 30.
When a green Henikin Ashi candle intersects with the linear regression upper deviation line (green line) and both indicators intersect with a Djinn prediction date a sell is triggered.
When a red Henikin Ashi candle intersects with the linear regression lower deviation line (red line) and both indicators intersect with a Djinn prediction date a buy is triggered.
This trading strategy works on daily, weekly and Monthly Djinn Predictive charts.
Trades made when the monthly, weekly and daily arrows are pointing in the same direction are the most profitable.
This is not trading advice. Trade at your own risk.

US NatGas Greatest decline FridayUS Natural Gas posted a great decline on Friday at the close of the markets. I am highlighting it because it is the greatest decline among the commodities I am watching. The fall was about 3%.
With demand down for energy, I foresee further fall in prices next week. This is a good time to short.


Natural Gas Target 1.94XRig Counts: 200 to 88, Production Decline + Industrial Gas Consumption. Short term target 1.94X.
These are just my thoughts not a trade call.

$NATGAS Short Entry 13:59:12 (UTC) Wed May 13, 2020$NATGAS Short Entry 13:59:12
(UTC) Wed May 13, 2020
Natural gas channel - buy opportunityA nice and clean channel on natural gas. Of course we need to await opening before we (can trade, duh) get confirmation. Breaking the channel would be bearish.
At the moment we are hoovering around the 1.75 level that has been a well-battled level over the last two months. You see a lot of noise around there.
Await confirmation by seeing gas finding support and trading up, and enter a long.
The channel-mid of around 1.9 seems a fair target for profit. With more risk, one can aim for channel resistance.
Decide your own enter and exit levels.
Trading is not about copying but about forming your own opinion.

I hope in demand rise . Natural gas demand is expected to start recovering in the coming weeks as states ease lockdowns and as demand for cooling rises in the summer months. In addition to expectations of higher demand, the supply of natural gas in the U.S. is dropping as gas producers lower production amid low prices while oil producers scale back oil output and with it – associated natural gas production from oil-directed wells.
disclaim : I am newbie in traders community .I am not financial advisor .


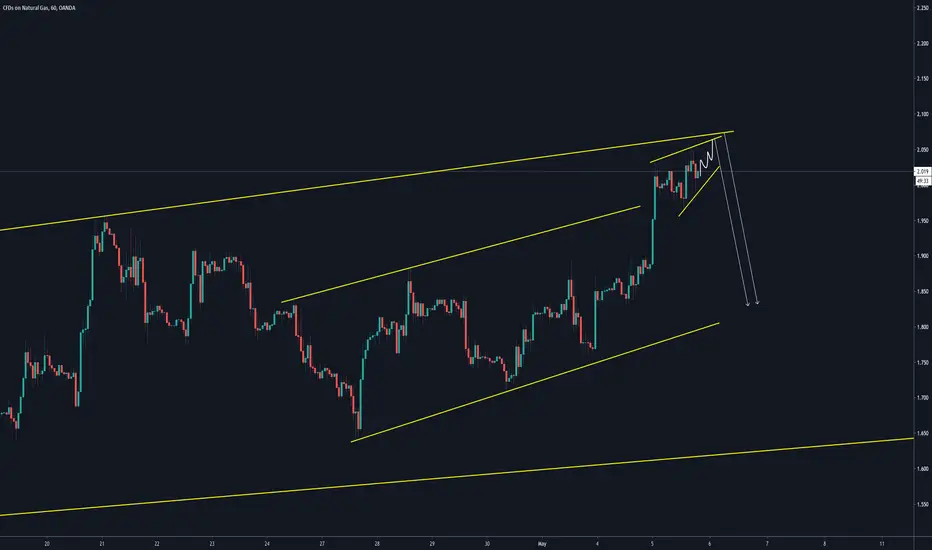
Natural Gas (NATGASUSD): Continuation Within Channel!
NATGAS is entering a strong zone of support.
from there we will expect a bullish continuation to 1.945 / 2.03 levels!

NATGASUSgas is now getting into a high value area now we can see how it's starting to move up so either we sell from the 3 touch or just go from the outer structure as seen looks nice clean
GBPCHF NATGAS AUDJPY breakdowns hi guys just a little breakdown on a few pairs and just waiting now for the right time to get in the trade stay patience we don't need to rush anything let it come to us :) please understand if price action changes then i will do my best update this

Strong Bearish downside Target 200-33 points weekly BASE#NG Gas
Last some week Pirce sideways and fake break, Currently price hit long term downside trend resistance.
Next, some month now Demand of Gas VERY LOW as Summer period starts, we will see come next week Price go back 1.510$ support
🛑SUPPORT/RESISTANCE
✅S1= 1.725
✅S2=1.510
✴️R1=1.840
✴️R2=1.920
Please like, share, comments and follow me to get daily base analysis
Thank you for your support, I appreciate it.

Natural Gas Long Opportunity5 waves down is completed with diverging RSI, chance for a reversal uptrend. The plan is to open long positions if break the two lines:
1st at 1.885( breaking the wave 4 high)
2nd at 2.035 (breaking the wave b high, inside wave 2)
Stop loss at 1.470.
You can choose to manage the positions by your own money management.
The first target is at the resistance level coincides the wave (4) but expect higher in longer run.
Wave count is invalid if break bellow 1.470, cheerss.

Upper limit around $37There is a possibility of Ugaz pushing up to the $35-37 range before coming back down...

NATGAS Giving us a LONG ENTRY!We are looking for the best entry, and this entry is not too far! we need to be focused in the next retest in the SHS and also in the ascendent triangle, 1.82 could be a good zone to enter in this value with a buy limit or set an alarm to see the best moment to the entry.
Have a nice day traders! give a LIKE and follow me for more analysis and entries!

I'm feelin' it - on the 4 hourI use Stupid Willy to find approximate bottoms for ugaz and it looks like we could have a good run here today!!!

NATGASUSDthis is at a key level now 2 outcomes with this as seen here ? we wait for the first move before buying or selling now all lines up in all the right area !!
