Natural Gas | More DownsidePlease support this idea with LIKE if you find it useful.
Overall we are moving in a Descending Channel and the previous rejection can lead us to the lower boundary being retested.
On closer look we see the price is under Ichi Cloud resistance zone and 50 MA dynamic resistance. Also price producing bearish engulfings, which confirms the decline.
Thank you for reading this idea! Hope it's been useful to you and some of us will turn it into profitable.
Remember this analysis is not 100% accurate. No single analysis is. To make a decision follow your own thoughts.
The information given is not a Financial Advice.
NATURAL GAS


Trade US Natural Gas Spot CFDDiscover US Natural Gas price in real-time with our live chart
Natural gas is a vital fuel, it currently supplies 22 per cent of the world's energy. Widely used for both commercial and industrial purposes, it is often chosen as an investment option by international investors seeking true asset class diversification in their portfolio.
According to the historical natural gas price chart, the commodity reached a record low of $1.04 in January 1992 and a record high of $15.78 in December 2005.
You can stay on top of the latest natural gas price with Capital.com.
Today, natural gas is considered one of the cleanest and safest fossil fuels available. It’s certainly a much more environmentally-friendly option than coal or petroleum. In the age of environmentalism, these unique properties of the commodity make it a popular energy choice. Consequently, investment in natural gas has increased in recent years.
Natural gas is used across the globe as an effective and inexpensive fuel for a variety of applications, from heating to cooking and in the generation of electricity. Every year, the world’s largest countries extract billions of cubic metres of the commodity.
Since the 2008 shale boom the United States has dominated the market as the world’s largest producer of natural gas. Today, the country operates over 900 public gas systems. Other major producers include Iran, Canada, Qatar, China and Russia, which supplies gas to Germany and the majority of Eastern Europe.
Natural gas is unique among commodities as its supply often does not meet the demand. Known as “seasonal mismatch,” demand is the highest and typically exceeds supply during the winter, while in summer months, demand is lower than the available supply.
Even small changes in the demand or supply of natural gas can cause significant price fluctuations. The price highly depends on the production process, weather conditions, economic growth, storage supplies and substitutes, such as hydroelectric, wind and solar power.
Discover the latest natural gas price today and trace the historical value of the commodity over the years with Capital.com’s natural gas chart.

NATGAS USD BUY (NATURAL GAS - US DOLLAR)Hi there. Price is forming a reversal pattern to change its direction. Wait for the price to complete the pattern and watch strong price action for buy.


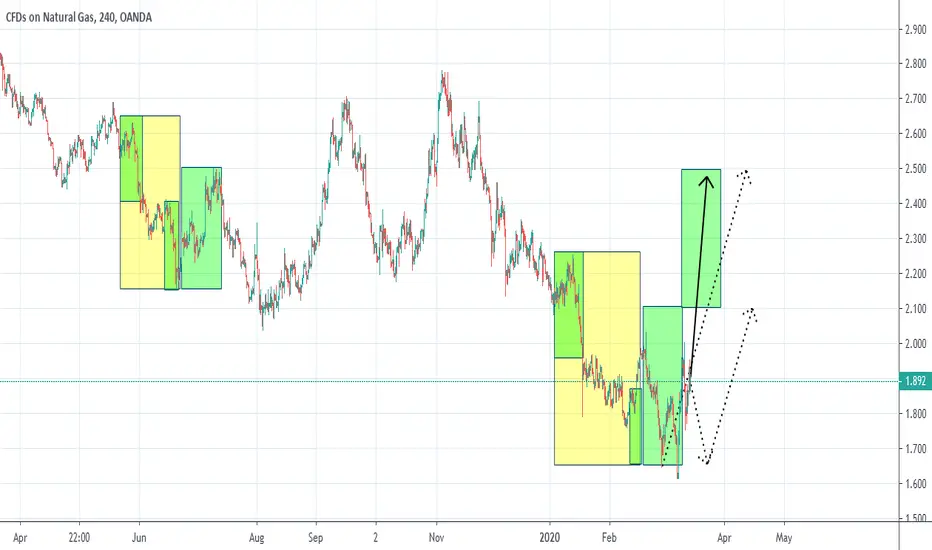
NATGASUSDSo taking this trade into what's happened with price before this is a no brainer if you ask me so we either break lower hitting the outer structure and then start a bullish run or we start from the double bottom.

Natural Gas (NATGASUSD): Bullish Forecast
Natural gas is testing a support line of a falling channel three days in a row!
with rejection and clear exhaustion on lower timeframes, I believe that we can expect a bullish reaction to higher structure levels.
key levels:
1.73 / 1.78

Natgas bullish divergence, are we reached the bottom?Bullish divergence on daily chart, first target 1.80!!!

XLE IS THE PLACE FOR MEBuy cheap. Sell expensive. Buy fear. Sell/short greed. I don't have an established trend here but I like energy long term. Now let's hope that ETF's don't collapse.

NATGAS BUY TP_2.139_18.24%_0.330pips_SL_1.699_6.08%_0.110pipsNATGAS BUY TP_2.139_18.24%_0.330pips_SL_1.699_6.08%_0.110pips


NATGASUSD possible higher rated upward momentumFollowing on from my previous analysis, I predicted a short followed by a long, this analysis stands, but I see the rate a climb bing quicker in the following few weeks

Natural GAS SHORT.Overextention to the up side and touching convergence of 2 major trend lines .
simple!

Nat Gas setupPrice testing the downtrend line again. A break to the upside and close above 2 is a buy signal.
Target 1 at 2.20, stop below the latest swing.
Good Luck!

SHORT NATGAS USD short selling because the candle breakout old support
double top break in M30 and H1
BUT you can wait for confirmation on D1 time frame Because the price is at the bottom of the channel and maybe go up
remind that you can wait for test and short sell again !


Weekly analysis on NG by ThinkinAntsOkToday we will focus on the Weekly chart on Natural Gas. Use this as a guide to develop your view of the chart:
Main items we can see:
a)Currently, the price is on a massive support zone
b)In 2012 and 2016 we observed massive reversal movements on the area between 1.90 and 1.60
c)If we are thinking about developing long setups, we have a good filter that has worked on previous situations
d)First, we need a clear breakout of the descending trendline / Second, we need a corrective movement / If that happens, the setup will be ready to trade.
e)This is a Swing view, which means that it requires patience to wait for the expected formation.
f) We will not develop short trades unless there are clear signs that the support zone is broken.

Natural Gas (up or down) Pick your poisonIn my own opinion, since Natural Gas first landed on the market in 2004, it has 1 all time low at 1.574, which is lower than 2004 and since then we have never tested this bottom again. I think with news of coronavirus, it is the perfect opportunity for this level to be tested and i think it will go much further down creating a new low for natural gas.
DISCLAIMER
Please note that this chart is an opinion based chart only. Please trade at your own risk

NATGASUSD exepcting higher bearish ocntinuation
ENTRY: 1.780
TP: 1.755
TP2: 1.735
TP3: 1.720
SL: 1.805
Chart time frame - 4H
Time for reaching TP - 1-2D
Follow, Like, Share or Comment
Thanks on supporting!
All best!


NGAS Posible longFormación de posible long en NGAS, hasta ahora lleva mucho momentum bajista, esperar rechazos y confirmaciones para posible entradas en long
