UPDATE NATGASUSD Short followed by LongFollowing on from my previous analysis, NATGASUSD has reached the short predicted, if follows my previous chart should now move north to around 2.125
NATURAL GAS

Interesting formation on Natural GasLet's see if it bounces again off that support area or just continues downwards.

NATGAS - price bounce from monthly supportThe US Natural Gas is now trading at a monthly low. From a technical perspective, price is now trading in the accumulation zone, MA's about to cross we expect the next push to the upside.
Price is growing with increasing volume, now retraced to the previous resistance now acting as support. Therefore we will long the commodity at the price of $1.89 per cubic feet.
The first target is the downwards trendline, at price $2.10. From there a retest of the low might happen. Our longer-term view on NATGAS is still bullish.
The past 5 weeks of Natural Gas Storage showed less than forecast, an increase in demand is signaled.
Traders if you follow this idea, we recommend entering with prudence and proper risk management according to your strategy.
Know your trading conditions for this asset. Spreads and lot sizes are high, do the research first.

The CHK perspectiveI like Chesapeake energy for the longer term investment. Energy has been lagging compared to other sectors over the last few years and there is tremendous potential in good energy companies. CHK is historically cheap and could do very well if energy takes off. However, I suspect more pain ahead for oil with the potential for an enormous flush.. perhaps below 2016 levels.. Regardless of that, I think oil goes bonkers high over the next 6-7 years. I'm looking at holding some longer term USO call options (if we see a deep oil flush) as well as a few good oil/energy companies.. CHK is one of those in my opinion. CHK could disappear.. there's always risk in investing but I'm accumulating shares of CHK sub .48 but I wouldn't be surprised to see .20 either. We have some chart history that demonstrates these exact type of moves- From current levels, a $20/share run would equate to a 45x (4500%).. a move back to the 2008 ($69 per share) high would be 16000+% (160x). It can go to $70+ or it can go to 0.. This is a long term trade that has some risks so I'm only willing to put in what I'm willing to lose.


Natural Gas NatgasOlder Chart with some weekly lines lightened. Heavy resistance from TA previous trendlines/breaks/ moving averages, etc. Watching current range, if I see a nice daily close above first resistance bottom line, I'll add to position. Keeping this simple. Will elaborate the chart later.

Natural Gas - Long term trade towards 2.78Disclaimer - This analysis alone DOES NOT warrant a buy or sell trade immediately. Before you enter any trade in the financial market, it is very important that you have a proper trading plan and risk management approach.
The sharing of this idea is neither necessarily indicative of nor a guarantee of future performance or success.

Mid Term NAGASUSD Short followed by LongI see a small drop first to around 1.660, in my idea this then longs without much resistance to around 2.125, I do see some action here, small retrace possibly to 1.950, but overall I see continuance moving to the 2.500 region

NATGAS SELL TP_1.730_5.21%_0.095pips_SL_1.851_1.42%_0.026pipsNATGAS SELL TP_1.730_5.21%_0.095pips_SL_1.851_1.42%_0.026pips

NATGAS : Going to Test 1.60$ on the BottomNATURAL GAS Price has been fallen continue since many Years , so i am expecting One drop possible aacording chart pattern, we can see new bottom which is around 1.50 Dollar.
Let see How Price Gone.
ThankYou & All the Best

Natural Gas (NATGASUSD): Bearish Forecast
Natgas has reached an important pivot point.
we have a perfect confluence of 618 retracement, resistance line of a falling channel and rsi swap.
I believe that the market may drop to the downside and soon we will see the retest of the current structure low.
Please, support the idea with like! Thank you!

NATGAS Analysis - Retrace Before Further Move DownwardFundamental $2.00 level has been broken, signaling how weak the market actually is, during a time it should be strong.
Due to oversold conditions, temporary prop back up to $2.05 - $2.11 (previous support) level is expected.
Natural gas analysts are expecting natgas production to remain high throughout 2020 which will eventually subside in 2021, when cuts will occur due to companies filing bankruptcy and other factors. Thus, the strong natgas production during extremely weak consumption will lead to this market retracing $1.60 low.
Natgas might also possibly complete the cycle seen in the daily/weekly charts to $1.30, which at that point you go all in long and become a millionaire. :) Good luck!


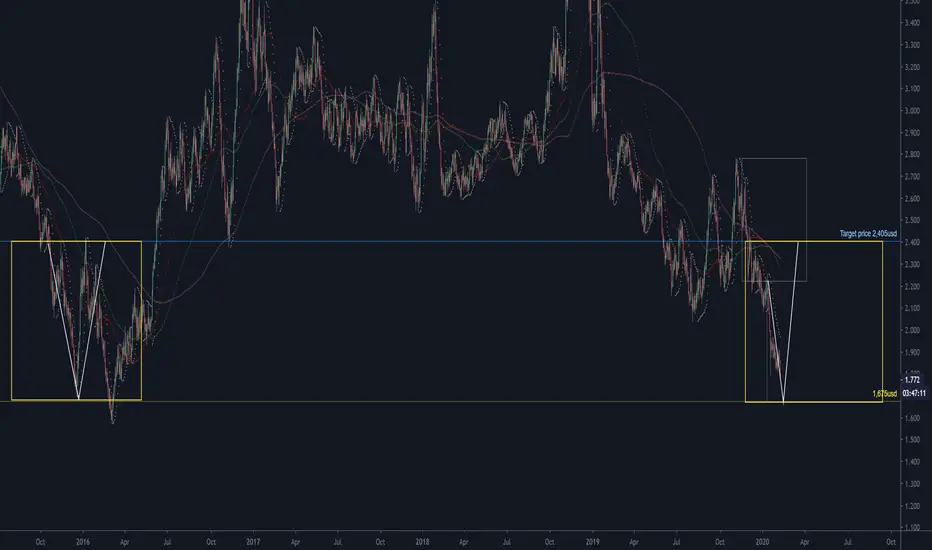
NATGASUSD long from 1.675usd level.NATGASUSD long from 1.675usd level. We wait for the time being. The rule set is that the movement of the chart is symmetric to the ATR closing values. However, there is a small screw. For better representation, the figure shows the time frame D1. In contrast, I calculated the ATR closing values based on the W1 data. Nevertheless, the end result is credible. Back to the chart. I assume that the exchange will back test the 1.675 usd level and turn north from here and start copying the first fractal shown in the D1 timeframe. If my analysis is correct, the target price rise is 2.405USD.
Natural Gas feb 6largest consumer of Natural Gas is the east coast and the weather is going to get cooler
around feb 7
(be safe and good trading)


NATGASUSD 31% correction gain.NATGASUSD 31% correction gain. I'm expecting a north turn in the exchange rate. There are two possible reasons for this. Both are technical. One is that the ATR final values were tested symmetrically. I present this on an additional chart. The other is that an earlier fractal copy starts the chart. The figure shows the first fractal. My guess is that the elevation can be copied. If the idea is right, there may now be a rise with a target price of 2,431 usd


Natural Gas Possible Bottoms and TargetNatural gas' price action is best contained within a downward channel on the weekly time frame.
There are two possible bottom scenarios.
1st Bottom: Within the downward channel the price is currently within a falling wedge. This is the third touch to the bottom of the wedge which in many cases means the price is likely to go up from here. If the price happens to breakout of the wedge, the wedge gives us a target that is near the top of the downward channel which is around $4.
2nd Bottom: The 2nd bottom scenario is simply the bottom of the channel. The channel is very well defined so if the price happens to go this low, I think there is a very good chance that this would be the absolute bottom.

NATURAL GAS USD BUY ON WEEKLYWe going to continue to the price action between $1.862 and $1.957. Most importantly is its 50% level at $1.910. Trader reaction to this level will determine the direction of the March natural gas futures contract today.
A trade through $1.862 will signal a resumption of the downtrend. A move through $1.957 will change the minor trend to up and shift momentum to the upside.
If there is a breakout to the upside, $2.033 to $2.076 becomes the primary upside target.

NATURAL GAS USDOUTLOOK: BULLISH
In the past few months NATGASUSD has been confounding forecasters - and whipsawing short-sellers - by rebounding sharply.

