NATURAL GAS Weekly ForecastNATURAL GAS Technical Analysis Chart Update
Time Frame - Daily
According to Long Time Frame #LTF we have BULLISH CHANNEL Pattern and it is Rejecting from the Upper Trend Line #UTL it can Follow Sell Trend because it Rejected the Bearish Trend with Strong Bearish Price Action
We have got ELLIOT WAVES as well in Long Time Frame #LTF it has Completed its Impulsive waves " 12345 " now it will Make Corrective waves " ABC " and Follow Sell Trend
In Shorter Time Frame #STF we have Rising Wedge we need to wait for the breakout of the Lower Trend Line #LTL and Retest then we can Enter in Sell
We have Strong Selling Divergence according to #RSI in Daily Time Frame #DTF
Natural

BOIL Leverage 3X Natural Gas ETF Cup and Handle LONG AMEX:BOIL
BOIL is showing a cup and handle pattern at present
lending increased probability of a bullish continuation
that could yield a 50% price rise over the 45-day width of
the cup. Macro and fundamental factors support ongoing
natural gas price escalations including the supply issues
in Europe, the heat wave from climate change causing
and so on. The cup and handle on a relatively long time
frame increases both its reliability and the time period
for which the pattern to play out.

NATURAL GAS - BAT PATTERN IN MAKINGNATURAL GAS is printing a bullish bat pattern. It is still in early stage as point C has defined its place. Pattern will complete at point D which is projected at 4.
The price has already been rejected at the key resistance on the daily chart, and RSI is headed downwards. There has also been a continuous decrease in volume from the first time the price tested the key resistance.
This may confirm that the price doesn’t have enough momentum to break through the resistance and is now set for a correction. There are a lot of contributing factors pointing to a bearish scenario for natural gas. Although the price might be bearish, watch out for relief pumps, especially on the support levels.
What do you think of the idea?

NATURAL GAS expected move Elliot Wave - NATGAS NATURALGASNATURAL GAS expected move Elliot Wave - NATGAS NATURALGAS
WAVE C PENDING - expected heading towards $4-$4.3

UNG (US Natural Gas ETF) - Weekly - Support, Resistance, TrendUNG (US Natural Gas ETF) - Weekly chart.
Support, Resistance, Trendlines for reference.
note: chart is on a Logarithmic scale.
05/11/2022.

#NATGAS - Surely not?Hi all!
This chart is pretty self explanatory and tells a lot of potential stories.
As we all know, NATGAS is a beast of it's own and often technicals are embarrassed by NATGAS movements.
But considering inflation, whispers of war, absurd weather, perhaps this isn't as crazy as it sounds.
Anyhow, I really wanted to put this out there as a lot of technical indicators are suggesting a bull run.
Weekly and Monthly RSIs are both towards oversold and the current political and economical situations point at a commodity bull run, especially is Oil and NatGas.

NATURAL GAS LONGHelloooooooo PIPPIN TRADERS!!! I'm back with another one. Natural gas is showing a sign of a small correction down to around 6.70 before we have another push upwards to 8.00. Good risk to reward...trade with care!!

NATURAL GAS Ready to Dump?For my idea I use my Script "ROAD TO DUBAI" (if you want to test it check this link)
As you can see there is a Fibonacci extension really interesting for a safe Short.
At worse case price can go up even further, at 9.1$ / 9.2$.
However there is others useful signals
We have a MACD SHORT CALL [
A couple of X Red Cross RSI Short Related call
An upper overextension at 8.78$ (with silver bar, stronger short possibility), usually when this appear means a Short is likely around this area
An 8.2 target (White EMA80) exactly on Fibonacci 0.5 Lines
Invalidation Should occur from 9.3$ or little above
This is not a financial advice, please always consider economical changes

NatGas UpHey.
NatGas, I'm betting that it goes up again after a little retracement. As far as I'm aware, there is still bullish sentiment on US Natural Gas, given the macroeconomic situation with Russia and everything.
God bless, and safe trading!
Remember, taking a bet in trading is okay, as long as you keep your stop losses tight. No need to lose your whole wallet on a single trade.
Peace out, in Jesus' name.
Disclaimer: I do not swear to abide by Tradingview's "House Rules", and therefore I won't be mad if my idea is hidden. I will never swear on anything, because Jesus told us not to.
I simply want to publish my idea.

Nat Gas Should Hold Support @ $6.5The natural gas market has been supply constrained ever since the Russian ukraine war started. The war is significant to the natural gas market because Russia is the worlds 2nd largest producer of natural gas. Russia also holds 20% of the worlds natural gas reserves. NAT GAS is trading above a crucial 10 year resistance level around $6.5, we broke this level around April 13th. Since breaking that level we saw NAT GAS trade up to $6.5, now we are seeing NAT GAS come back down to this level, I believe we see this $6.5 level hold and NAT GAS move higher

NATURAL GAS 📉📉📉Expecting bullish price action on this pair but simply on a fundamental reason, price tapped on 7.0$ institional figure taking out some retail stops below this price area and for now we are going for the ATH - ALL TIME HIGH.
What do you think ? Comment below..

Natural Gas: still a long way to go; see measured moveNatgas may still have a very big upside considering Russia will be doing everything to win the war before
May 9.
It is very probable that Natgas will be able to reach the 1.618 FIBO level 8.255 in June 2022.
Very Interestingly, 8.255 is also the measured move from the triangle.(see chart)
Not trading advice

NATURAL GAS LONGS ACTIVE 📉📉📉📉 Expecting bullish price action on NATURAL GAS as price is in a clear bullish market strucutre on D1/H4 timeframe, price made a breakout above the weekly highs retraced back into the H4 imbalance testing the weekly highs and clearly reject from that area. I think we will see 6.0 ASAP.
From a market seasonality standpoint we are very bullish as naturalgas should rise in this period of the year + the problems between the Russian Federation and European Union about the gas delivery in the Europe.
What do you think ? Where we go next ?

natural gas - short - Head and ShoulderThe price action is very bullish but is arrived on biggest resistence area and in 15minute time frame is creating a potential H&S patter. If confirmed the break of neck line we can have a short impulse to near support area.

NATURAL GAS LONGS 📉📉📉📉 Expecting bullish price action on NATURAL GAS from a medium-long term perspective as we are in a HTF BULLISH MARKET STRUCUTRE, price kept the 4.5 psychological barrier without breaking it to the downside, we have bearish imbalances somwhere around 5.0 that should magnetize price back there, Market Seasonality is very bullish on chart as we have a BULLISH CYLCE + the fundamental context makes me thing we will go higher. I think in the next 2-3monts we will have a huge problem with supply/demand because Russia advised European Union of higher prices on GAS.
What do you think ? Comment below...

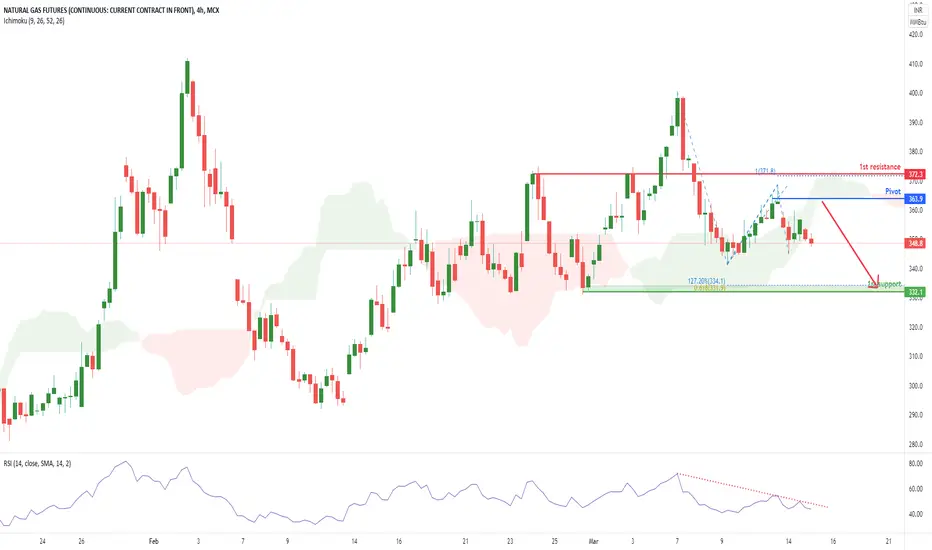
Natural Gases Futures (NG!), H4 Potential for dip!Type: Bearish drop
Resistance : 372
Pivot: 363.9
Support : 332
Preferred case: We see the potential for a further bearish drop from our Pivot at 363.9 in line swing high resistance towards our 1st support at 332 in line with 127.2% Fibonacci projection and 61.8% Fibonacci retracement. Our bearish bias is further supported prices trading below our ichimoku clouds.
Alternative scenario: If prices were to reverse, they can potentially climb towards our 1st resistance at 372 which is in line with 100% Fibonacci projection
Fundamentals: Warmer weather conditions and renewable energy sources might mean temporary setback on the commodities
Natural Gas - updateNatural Gas - idea update
Flat situation... but is it possibile a new short action in the next week

$GLOP - ASCENDING TRIANGLE BREAKOUT Wrote about this stock earlier today or yesterday.
Continued volatility within LNG should make commodity transporters like $GLOP skyrocket.
Large cup and handle and ascending triangle shows this name is getting ready for it's 15 minutes of fame.

Europe Looks Beyond Russia for Natural Gas. LNGIt takes a brave investor to bet on the outcome of Vladimir Putin’s saber rattling around his neighbor Ukraine. One result of the Ukraine crisis seems more predictable: The European Union will look to cut its dependence on Russian natural gas, which currently accounts for 40% of consumption. Companies from Norway to Texas might benefit.
The simplest way to replace Russian flows, if you were sitting over a game of Risk on a rainy afternoon, would be U.S. liquefied natural gas. America has more gas in the ground than it can use domestically. LNG output jumped 42% year on year in the first half of 2021.
It could climb another 80% over the next five years, says Randy Giveans, head of energy maritime equity research at Jefferies. Top producer Cheniere Energy LNG+0.12% is earning $100 million on every shipload right now, Giveans estimates. Its stock has risen by two-thirds over the past year.
The first position was bought last Friday at 116$. Long-term deal.

Long NATGAS short term optionNatural has been on a decline ever since their recent high of 5.3.
Price is heavily oversold here.
We can see that the trend has recently left the falling flag and most recently breaking out of the descending triangle, recording a positive RSI divergence there too.
Currently on a important resistance level and my first target is the resistance up in a area around 4.5.

sell pullback on natural gasslight pause in the market after a bull run. going to pull back to pervious resistance that will become support.

YATEC (YAKG) - The potential unicorn at LNG Market (Part II)Another confirmation of my confidence in the YATEC (MOEX:YAKG) - Zhejiang Provincial Energy Group Co Ltd buys 10% of YAKG and its subsidiary - GlobalTec for 500 million euro.
The Chinese company evaluated YAKG as 500 RUB per share, current market price is 140. I suppose it will grow more than 5 times next autumn.
Its not investment suggestion, but Im buying YATEC for long.
#LNG #YAKG #MOEX #ZHEIJANG

Natural Gas - Potential Path for next week? As we know, NATGAS is a beast with it's own mind and often technicals fail to support it's move, but here's one anyway!
As you can see there's a descending flag that has been accumulating and I've used a fib extension to determine it's next target.
It's severely oversold on the hourly and the 4hr charts, due to I'm sure the profit ejections from the previous run.
The most recent reports aren't that bearish IMO and I can see this easily taking flight again soon.
