Natural Gas Price Forecast | Oil, Silver, Gold00:00 Natural Gas stock Bulls NatGas Support & Resistance Guide
09:07 AMEX:UNG Stock Forecast
12:15 USO Oil Stock Forecast
15:22 DXY US dollar Stock Forecast
16:43 Gold XAUUSD Stock Forecast
17:28 Silver XAGUSD
Natural Gas Price Forecast | Oil, Silver, Gold
Natural Gas

Natural Gas Price Forecast | Oil, Silver, Gold00:00 Natural Gas futures stock NatGas Support & Resistance Guide
04:04 AMEX:UNG Stock Forecast
04:42 Oil Price Forecast
05:50 DXY US dollar Stock Forecast
06:50 Gold XAUUSD Stock Forecast
08:36 Silver XAGUSD
Natural Gas Price Forecast | Oil, Silver, Gold

NATGAS Bullish Breakout! Buy!
Hello,Traders!
NATGAS made a gap up
Then hit a horizontal level
Of 1.989 then made a breakout
And the breakout is confirmed
So we are bullish biased
And we will be expecting
A further move up
Buy!
Like, comment and subscribe to help us grow!
Check out other forecasts below too!

$NG1 $NATGAS #NaturalGas$NG1 PEPPERSTONE:NATGAS #NaturalGas is now testing a 33 years old wedge for a bit more than 12 times. Any close below 1.50 causes a free fall, however, there is a descending lower channel wedge extending since 2009 around 1$.

Natural Gas Oil, Silver, DXY, Gold Price ForecastSilver, Natural Gas DXY, Gold Oil Price Forecast
00:00 Natural Gas stock Bulls NatGas Support & Resistance Guide
04:36 AMEX:UNG Stock Forecast
09:16 USO Oil Stock Forecast
12:18 DXY US dollar Stock Forecast
14:04 Gold XAUUSD Stock Forecast
15:44 Silver XAGUSD

NATURAL CallsLooks like Natural Gas is trending in a channel and just landed on the its support area. Theres a high probability the price will reverse from this area as its been consolidating there for quite some time now.

Natural Gas Price Forecast | DXY Oil, Silver, GoldNatural Gas | Oil, Silver, DXY Gold Price Forecast

Natural Gas Price Forecast | DXY Oil, Silver, Gold
00:00 Natural Gas stock Bulls NatGas Support & Resistance Guide
05:33 AMEX:UNG Stock Forecast
07:00 USO Oil Stock Forecast
09:30 DXY US dollar Stock Forecast
10:42 Gold XAUUSD Stock Forecast
13:29 Silver XAGUSD
Natural Gas Price Forecast | DXY Oil, Silver, Gold

Natural Gas Price Forecast | Oil, US Dollar, Silver, Gold AnalysNatural Gas Price Forecast | Oil, US Dollar, Silver, Gold Analysis

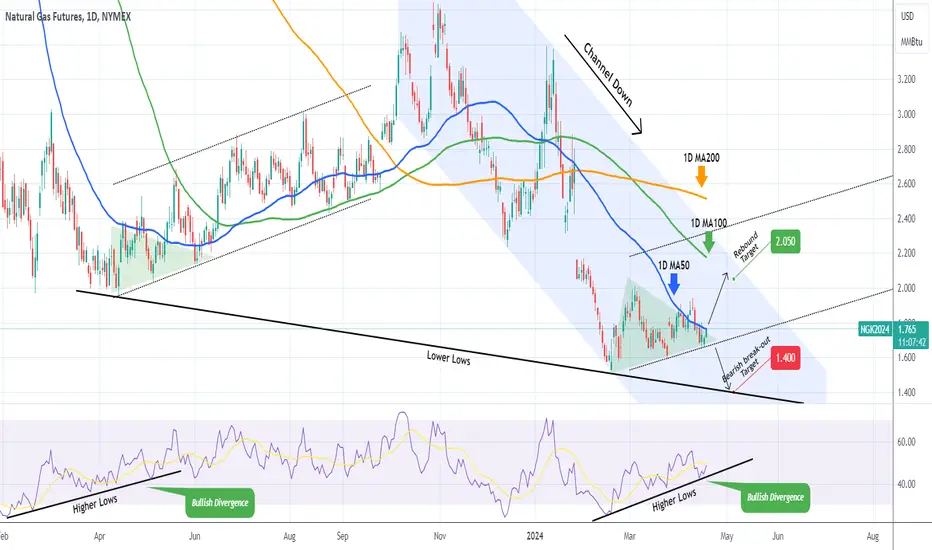
NATURAL GAS Can turn bullish on the short-term.Natural Gas (NG1!) has been posting Higher Lows, three so far since the February 20 Low, despite the fact that it remains within a Channel Down since the October 27 2023 High. This might be a short-term trend change similar to the Channel Up that started on the April 14 2023 Low following a sharp and long-term selling sequence. Notice also the Higher Lows Bullish Divergence on the 1D RSI patterns.
As long as the bottom of the (dotted) Channel Up holds, we will be bullish short-term, targeting the 1D MA100 (green trend-line) at 2.050. If the bottom of the Channel Down breaks, we will turn bearish, targeting the Lower Lows trend-line at 1.400. The risk is low on both sides.
-------------------------------------------------------------------------------
** Please LIKE 👍, FOLLOW ✅, SHARE 🙌 and COMMENT ✍ if you enjoy this idea! Also share your ideas and charts in the comments section below! This is best way to keep it relevant, support us, keep the content here free and allow the idea to reach as many people as possible. **
-------------------------------------------------------------------------------
💸💸💸💸💸💸
👇 👇 👇 👇 👇 👇
Natural Gas to $2.55On a seasonal basis over the last 30 years the price of Natural Gas begins to rise now into August. This year's price is tracking very closely to the historical price. I think we're about to rise at least to $2.55.
NYMEX:NG1!

It's a matter of WHEN it explodes; not IF Don't know how this plays out in the short-term... but it will explode soon (likely this spring or summer at the latest). If it does flush lower one last time, I'm looking at the $1.30 region... hitting UBER oversold on the quarterly, monthly and weekly charts.

NATGAS Swing Long Trade! Buy!
Hello,Traders!
NATGAS has retested a massive
Horizontal support level of 1.450$
And already made a rebound
So we will be expecting a
Further move up
Buy!
Like, comment and subscribe to help us grow!
Check out other forecasts below too!

Natural Gas (NGAS) - WEEKLY FORECASTForecast: Start of Bullish Trend (Daily)
Invalidation Level: 1.580
Only buy when the price is close to these levels: 1.745; 2.026 (R/S);

✅NATGAS MASSIVE LONG LONG🚀
✅NATGAS is trading in a
Downtrend but the price
Has reached a massive
Horizontal support level
Of 1.5$ which is both
A round number and a hasn't
Been breached since year 1995
So we can be pretty confident
In that a rebound is to be expected
And thus a swing long trade
On Gas makes sense
LONG🚀
✅Like and subscribe to never miss a new idea!✅

Spy / Oil / Natural Gas - Market Analysis CPI comes in hotter than consensus.
IWM slaughtered / QQQ under pressure / SPY closes negative.
Yields & Dollar ripping.
Oil ripping / Natural Gas selloff.
Are we entering a new reflation trend?

NATURAL GAS - Bullish Falling Wedge 📈Hi Traders !
The NATGAS Price Formed a Falling Wedge Pattern.
Currently, The Price Broke The Resistance Line !
So, I Predict a Bullish Move📈
-------------
TARGET: 1.908🎯

CPK - Big moving coming? This chart has gone through ample consolidation.
Once this pattern breaks its going to be a very powerful move.
Being the fact that were seeing a bullish shift in Utilities and gas & Oil, we think this name is setting up for a upside move.
if Nat gas makes a true bottom this name will likely outperform.
This is a lighter volume name so trade with caution.

Natural Gas Price Analysis Forecast | Oil, US Dollar, Silver, GoNatural Gas Price Analysis Forecast | Oil, US Dollar, Silver, Gold
00:00 Natural Gas futures stock NatGas Support & Resistance Guide
06:29 AMEX:UNG Stock Forecast
07:57 Oil Price Forecast
11:28 DXY US dollar Stock Forecast
12:32 Gold XAUUSD Stock Forecast
13:07 Silver XAGUSD

Natural Gas Price Forecast | DXY Silver Gold AnalysisNatural Gas Price Forecast | DXY Silver Gold Analysis
00:00 Natural Gas futures stock NatGas Support & Resistance Guide
06:02 AMEX:UNG Stock Forecast
09:02 DXY US dollar Stock Forecast
10:54 Gold XAUUSD Stock Forecast
13:28 Silver XAGUSD

Natural Gas closed bullishly today!Nat gas confirmed a daily chart breakout!
Its looking likely that we are now putting in a basing formation to move higher.
Now that we are holding above $1.86...we could start to see shorts cover.
I remain bullish as long as were above this key gap zone from 2020.
Nat gas resource stocks are continuing to show signs of accumulation.
$2.25 upside target on watch. $3- $4 by end of year.

Natural Gas Price Forecast | DXY Crude Oil Silver Gold Analysis
00:00 Natural Gas stock NatGas Support & Resistance Guide
06:59 AMEX:UNG Stock Forecast
09:30 USO Oil Stock Forecast
10:49 DXY US dollar Stock Forecast
12:27 Gold XAUUSD Stock Forecast
13:28 Silver XAGUSD
Natural Gas Price Forecast | DXY Crude Oil Silver Gold Analysis

Bullish Diamond playing out?Hey folks, This one has caught my eye, compressed bullish diamond that looks ready for an expansion phase and is in price discovery. This is another play that I believe will benefit greatly from a Trump win, but has some near term potential based on the chart and it looks primed for some material news.
Also, look at those earnings! this is a specimen in the making imo
Happy Trading and thank you for your time!
OnePath
