Natural Gas Further DeclinesTraders are currently reducing natural gas losses, but the outlook for the summer is unimpressive, combined with technical factors, which suggests the possibility of further declines in the future.
Natural gas is trading on the weakside of $2.432 (R1), making it new resistance. Overcoming this level will indicate the return of buyers with $2.638 (R2) the next target.
A sustained move under $2.432 (R1) will signal the presence of sellers. If this generates enough downside momentum then look for the selling to possibly extend into $2.168 (Pivot), followed by $1.962 (S1)
S1 – $1.962 R1 – $2.432
S2 – $1.698 R2 – $2.638
S3 – $1.286 R3 – $2.902
Bearish Weather Continues
The current weather patterns are unfavorable for natural gas prices, as systems in the southern US are preventing widespread high temperatures. This bearish weather is expected to continue until hotter patterns arrive, which is projected to be around June 6-10.
Although natural gas prices are increasing on Wednesday, it is not being influenced by the weather. During the May 24-30 period, the US will experience active weather systems with showers, thunderstorms, and temperatures ranging from the 60s to 80s, except for hotter conditions in the Southwest deserts and South Texas reaching the 90s. The Great Lakes and Northeast regions will have cooler-than-normal temperatures, with overnight lows dropping into the upper 30s and 40s. This may result in a slight increase in heating demand.
Canadian Gas Exports to U.S. Normalize
Canadian natural gas exports to the United States have returned to normal levels following disruptions caused by wildfires in Alberta and other western provinces. This has led to a significant drop in U.S. gas futures, as Canada supplies around 8% of the gas consumed or exported by the U.S. In the past weeks, gas flows from Canada averaged 7.2 billion cubic feet per day (bcfd), lower than the year’s average of 8.3 bcfd.
However, the amount of gas exported from Canada to the U.S. is expected to remain near a three-week high of 8.1 bcfd. The wildfires had forced Canadian producers to cut exports to a low of 6.4 bcfd. Overall, the return to normal gas flows from Canada has impacted gas prices and market dynamics in the U.S.
Supply Dynamics
Gas output in the U.S. Lower 48 states reached 101.5 billion cubic feet per day (bcfd) so far in May, surpassing April’s record of 101.4 bcfd. Additionally, gas exports from Canada to the United States were expected to rise to 8.2 bcfd, a near three-week high.
Demand Dynamics
Despite predictions of slightly increased gas demand in the next two weeks, particularly due to low wind power generation, gas futures still experienced a decline. The proportion of U.S. power generated by wind dropped to 7% compared to the previous week’s high of 17%. This decline in wind power led to an increase in gas consumption for electricity generation, particularly in Texas.
In the short term, the outlook for natural gas is bearish. The decrease in wind power generation has resulted in higher gas usage for electricity production, reducing the available supply for storage. Meteorologists project mostly normal weather conditions in the Lower 48 states, except for some colder-than-normal days from May 24-28. Refinitiv forecasts a slight decrease in U.S. gas demand, including exports, from 90.4 bcfd to 89.8 bcfd next week, with revised higher forecasts compared to the previous day’s outlook. These factors contribute to the bearish sentiment in the market.
Naturalgasbuy

Natural Gas Psychology | In-depth Support & Resistance Guide- Natural Gas First Daily uptrend in a while, still continuing
- potential Weekly bull flag if we don't retrace over 0.382
- Next key resistance at 2.65 zone

Natural GAS : LONGNatural gas bounced from a low of $1.95/MMBTU, where almost all producers lose money.
Since natural gas and crude oil are near or below breakeven levels, producers are reducing their drilling rate - likely lowering production levels given the lack of capacity.
The negative shift in weather, falling rig count, and potential export boost from Freeport may push natural gas back into a shortage over the coming months.
While natural gas spot prices appear likely bottoming, UNG's immense "contango" pressure remains a key investment rig factor.
Source : Seeking Alpha

NATURAL GAS - Why I am Bullish - FULL SETUPWait for the small trend (blue line) to be broken upwards with confirmation of retest and rejection and from there you can enter LONG.
We have interesting news from SAPPORO, which announced today that they will reduce GAS production, but, a big BUT, they mentioned that they will temporarily stop investments in this sector.
On the one hand, this can scare small investors and the price can make a DUMP up to the 1.8 area and from there the accumulation and capitulation necessary to go up, or it can break this trend even on Monday and see the beginning of a BULLMARKET for gas.
Personally, I think we will see an increase.
But I have a BUY order at 1.80 ready so as not to miss the opportunity.

Natural Gas Long Term Outlook | Importance of 4H Trend change | - AMEX:NG AMEX:UNG AMEX:BOIL cant stress enough we need to change trends, even if it is a very big move it will just fade if no trends are changed
- need to change the 4h and daily trend to the bulls
- likely tightening up in a equilibrium into May, still holding the teal support line.

Natural Gas $UNG $BOIL NG - Future Price Outlook- UNG NG NATGAS 6h 12 EMA is my short term guide
- weekly bear flag potentially confirming
- 52 week low support bulls need to defend
- 1h equilibrium pattern will break Monday

Natural Gas long setup There is a possibility of a bullish wave
I cannot be certain that it will be an impulse wave that ends at levels of 13 USD, but it is certain that it will be fast until levels from 6.5 to 8 USD.
my long setup in the chart
good luck !

NATURALGAS is at good place to buyBuy NATURALGAS here.
It's energy...
Remember 2 years ago oil was 15USD, after that it reach to 130 USD.
I am opening long here and expecting 2-3 times more price within 3 months

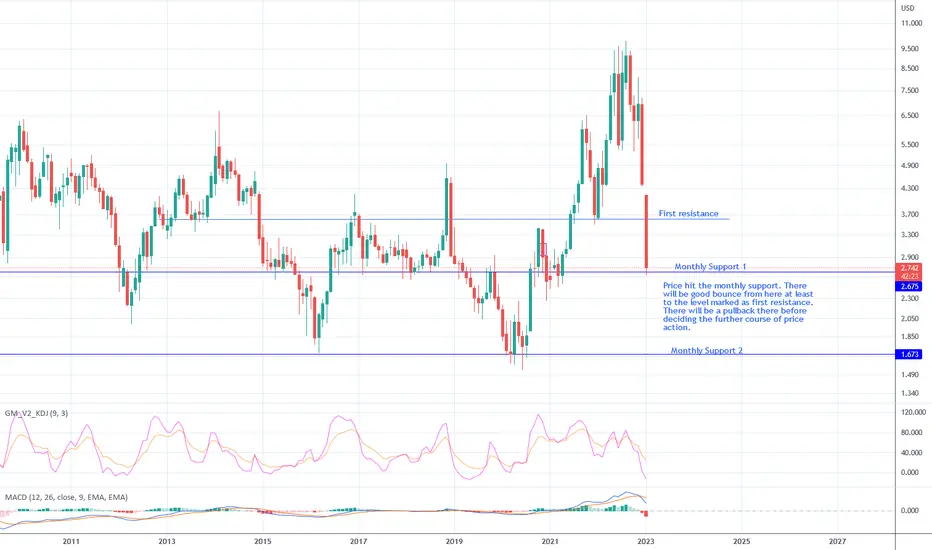
NATURAL Price hit the monthly support. A bounce on way.Price hit the monthly support. There will be good bounce from here at least to the level marked as first resistance. There will be a pullback there before deciding the further course of price action.
EWT – Is Natural Gas Prepared for a Reversal?In our previous article, we discussed impulsive wave C and its continuation. On 20 January 2023 , Price achieved our all given targets.
Click here -
-----------------------------------------------------
Timeframe :
MCX Natural gas has accomplished the corrective wave B and started falling for impulsive wave C. Price has given a reversal from previous wave C, but it is no conclusive evidence that it has completed wave c.
When it comes to confirmation, Traders should watch the level of 313 . If the price breaks out the 313 , it will enter into the parallel channel. Traders can buy for the following targets: 321 – 340 – 366 .
Don’t forget prices are moving outside the channel, which is a negative point for traders. Bearish continuation is possible if the price sustains below wave (4).
I will update further information soon.

NatGas: Don't trip 🚶🏼NatGas is currently facing down and should leave the turquoise target zone to climb below the support line at $4.750 to complete the pink wave iii. Our alternative scenario implies, that the course could rise above the resistance mark at $7.064 instead, if the course would stay above the $5.337-mark. After the completion of the pink iii in our primary scenario, we're expecting the course to rise between $4.750 and $5.337 to finish off the pink wave iv, before dropping back South. The downwards slope should stretch until the turquoise target zone between $3.436 and $1.880 to end the green wave .

NATURALGAS - Bullish price action ✅Hello traders!
‼️ This is my analysis of NATURALGAS .
Here we can see that price rejected one more time from support zone, so I expect we can see bullish price action upcoming days, but for medium term perspective I see price to take out liquidity below support zone.
Like, comment, and subscribe to be in touch with my content!

NATURALGAS - Long from here ✅Hello traders!
‼️ This is my analysis of NATURALGAS.
Here we are bullish from an H4 timeframe perspective, so I am looking for longs. I expect bullish price action from here as the price fills the imbalance and could reject from the bullish orderblock.
Like, comment, and subscribe to be in touch with my content!

NATURALGAS - Long from bullish orderblock ✅Hello traders!
‼️ This is my analysis on NATURALGAS .
Here we are bullish from H4 timeframe perspective, so I am looking for longs. I expect price to continue the retracement to fill the imbalances lower and then to reject from bullish orderblock + psychological price level 7.000.
Like, comment and subscribe to be in touch with my content!

NATURALGAS - Fill the gap ✅Hello traders!
‼️ This is my analysis on NATURALGAS .
Here we are bullish from H4 timeframe perspective, so I am looking for longs. I expect price to fill that gap above and the to make a retracement to look for a long from trendline.
Like, comment and subscribe to be in touch with my content!

NATURALGAS - Important level ✅Hello traders!
‼️ This is my analysis on NATURALGAS .
Here we are around to an important level, as if price breaks out the support zone I will consider that we are in a bear market, which means I will look only for shorts. Also, we could see a rejection from strong support level.
Like, comment and subscribe to be in touch with my content!

NATURALGAS - Breaks out the range ✅Hello traders!
⁉️This is my analysis on NaturalGas .
Here we are in a range for couple of weeks, I expect price to break out the range to fill the imbalance and then to reject from resistance.
Like, comment and subscribe to be in touch with my content!

NATURALGAS - Long to resistance ✅Hello traders!
⁉️This is my analysis on NATURALGAS .
Here I expect bullish price action after price filled the imbalance from 6.613. I see price to take out buy side liquidity and to fill the imbalance from 7.667, where I expect to reject from resistance.
Like, comment and subscribe to be in touch with my content!

Natural Gas | European Natural Gas Pipeline Closed IndefinitelyGazprom, the russian state-owned energy giant, cut indefinitely the flow of natural gas through the Nord Stream 1 pipeline into Germany citing an oil spill in a turbine.
This looks like the weaponization of energy flows by the russian authorities.
Russia will not restart gas supplies to Europe until western sanctions are lifted, official said.
My chart scenario is a triple top formation with short term price target for Natural Gas of $9.5.
Looking forward to read your opinion about it.

Jamie Gun2Head Trade - Buying Natural GasTrade Idea: Buying Natural Gas
Reasoning: Buying natural gas at a support level, currently in a strong uptrend
Entry Level: 8.909
Take Profit Level: 9.980
Stop Loss: 8.620
Risk/Reward: 3.71:1
Disclaimer – Signal Centre. Please be reminded – you alone are responsible for your trading – both gains and losses. There is a very high degree of risk involved in trading. The technical analysis , like all indicators, strategies, columns, articles and other features accessible on/though this site is for informational purposes only and should not be construed as investment advice by you. Your use of the technical analysis , as would also your use of all mentioned indicators, strategies, columns, articles and all other features, is entirely at your own risk and it is your sole responsibility to evaluate the accuracy, completeness and usefulness (including suitability) of the information. You should assess the risk of any trade with your financial adviser and make your own independent decision(s) regarding any tradable products which may be the subject matter of the technical analysis or any of the said indicators, strategies, columns, articles and all other features.

NaturalGasNG has reached months long resistance and has given beautiful inverted H&S, Cup and Handle pattern. Above 542, it will move very fast.

Bounce Patrol?!Another potential bounce zone here. Looking for convincing rejection on the lower TF and will take it up to the blue zone. Potential 2.85 R!

US Natural Gas Had Its Worst Day Since 2018: RSI falls Below 50US natural gas prices posted their worst daily performance since mid-November 2018 today, plummeting 17% to $7.2/MMBtu, as of writing, after Freeport LNG announced early Tuesday morning that it does not expect the export facility to resume full plant operations until late 2022 due to the explosion occurred on June 8.
The Freeport LNG facility has a production of 2 billion cubic feet per day, or around 16% of US LNG export capability, and has been operating at near full capacity in recent months.
The disruption at one of the largest US liquefied natural gas export terminals will put a severe upward pressure on European gas prices ( Dutch TTF ), which have been falling in recent months as Europe has significantly increased its liquified natural gas imports from the United States.
Technically, US natural gas prices are now testing the 2022 bullish trendline, with the momentum indicator (14-day RSI) dropping to 38, the lowest level since the start of the year.
A breach below the psychological threshold of $7/MMBtu would open the door for a bearish assault to the nearest support in the 6.50 zone (lows of April 25 and May 10).
