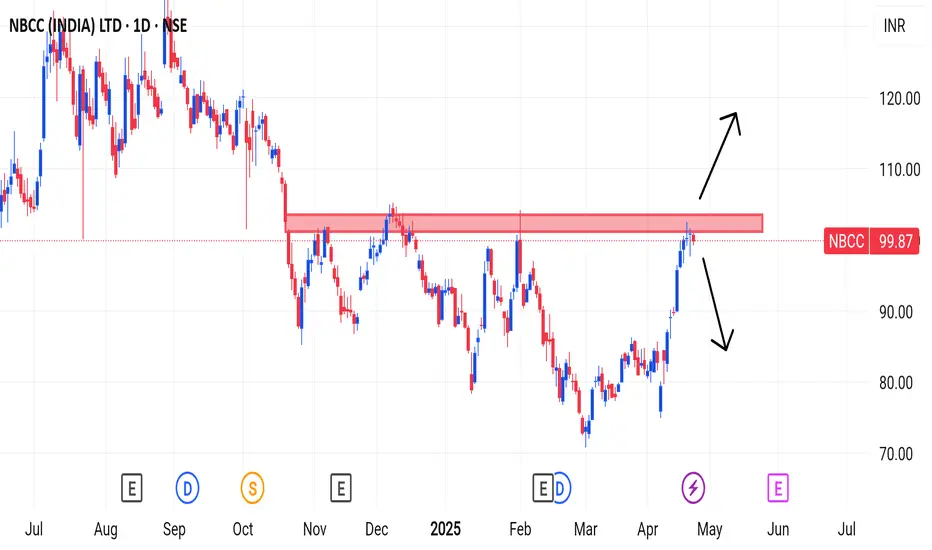
NBCCAn uptrend can be expected above the resistance level.
If it comes back below the resistance level the selling is expected to continue
If you find this helpful and want more FREE forecasts in TradingView, Hit the 'BOOST' button
Drop some feedback in the comments below! (e.g., What did you find most useful?
How can we improve?)
Your support is appreciated!
Now, it's your turn!
Be sure to leave a comment; let us know how you see this opportunity and forecast.
Have a successful week
DISCLAIMER: I am NOT a SEBI registered advisor or a financial adviser. All the views are for educational purpose only
Nbcctrend
NBCC forming CUP patternNBCC has formed a CUP chart pattern and traded near neckline level 146.
The volume is increasing as the price is nearing the neckline level. It tried to break the neckline before, but it was a fake breakout or was not sustained.
The monthly RSI is over 78, the weekly RSI is almost 64, taking support at 60, and the daily RSI crosses 60 from below.
If you measure the depth of the cup and clone it over the neckline, that would be your target, and the previous higher low would be your stop loss. If the trade goes as described, it would give you a risk-to-reward ratio over 3.

