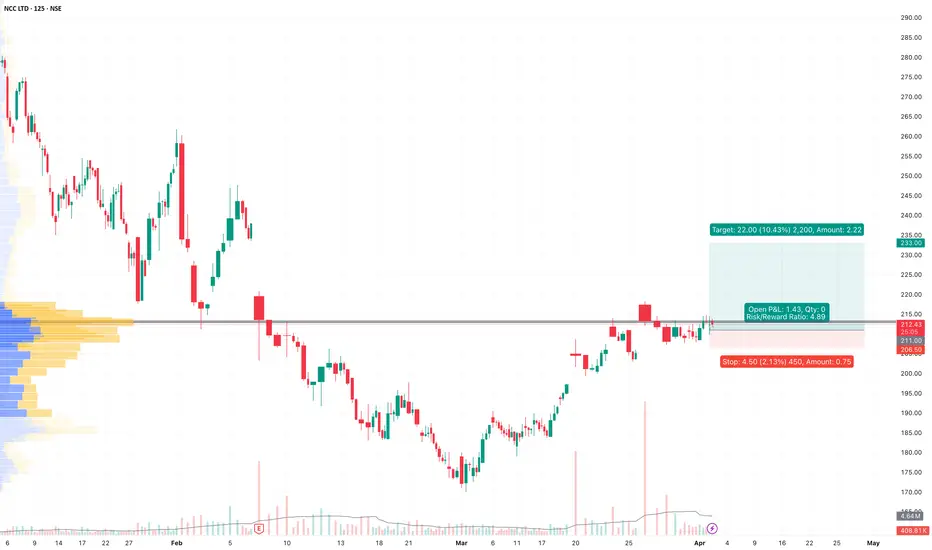
NCC - NCC LTD (2 hours chart, NSE) - Long PositionNCC - NCC LTD (2 hours chart, NSE) - Long Position; short-term research idea.
Risk assessment: High {volume & support structure integrity risk}
Risk/Reward ratio ~ 4.9
Current Market Price (CMP) ~ 212.70
Entry limit range ~ 212.50 to 209.50 (Avg. - 211) on April 02, 2025 at 12:53 PM.
1. Target limit ~ 223 (+5.69%; +12 points)
2. Target limit ~ 233 (+10.43%; +22 points)
Stop order limit ~ 206.5 (-2.13%; -4.5 points)
Disclaimer: Investments in securities markets are subject to market risks. All information presented in this group is strictly for reference and personal study purposes only and is not a recommendation and/or a solicitation to act upon under any interpretation of the letter.
LEGEND:
{curly brackets} = observation notes
= important updates
(parentheses) = information details
~ tilde/approximation = variable value
-hyphen = fixed value
NCC

NCC LTD ---- GIVES BRAKEOUT ON DAILY CHARTNSE:NCC
NCC Ltd Gives Brake out on Daily chart,
Buy Near 320
Sl 295
Target 380+
Time duration 15-20 days
Risk Reward Ratio - 1 : 2.50
Profit on capital Ratio 18%

NCC Breakout ?Volumes are high
Can be a Breakout at ATH.
Disclaimer : This is not a Buy or Sell recommendation. Please consult your financial advisor before making any investments . This is for Educational purpose only.

NCC long idea LONG TERM PICK , can buy around 148/149 sl 134
solid order book , hopefully company walks the talk

NCC LTDNCC has breakout ATH level and create good opportinuty for positional trade
and this is just for Educational purpose only

NCC nudging up again. NCC Ltd. (Nagarjuna Construction Company) builds residential properties, industrial facilities, public buildings, roads, civil engineering structures and other types of infrastructure. The company also offers input materials used in construction, such as aggregates and asphalt, and conducts paving. Operations also include commercial property development. NCC Ltd. CMP is 150.40.
The Negative aspects of the company is MFs are decreasing stake. The Positive aspects of the company are low debt, zero promoter pledge, FIIs are increasing stake, improving annual net profit, improving cash from operations annual.
Entry after closing above 152. Targets in the stock will be 162 and 176. Long term targets in the stock will be 190. Stop loss in the stock should be maintained at closing below 135.
The above information is provided for educational purpose, analysis and paper trading only. Please don't treat this as a buy or sell recommendation for the stock. We will not be responsible for any Profit or loss that may occur due to any financial decision taken based on any data provided in this message.


NCC LEVELS ...01/06/2022 (W Candle)NCC now waiting for trend breakout and fib levels, once its closing above 65 at weekly then its move 90+

NCC Ltd - 07.01.2022NCC Ltd - 07.01.2022
The stock is trading @ 70 levels
There is a MACD Bullish Divergence in weekly chart
There is a SPINNING TOP followed by DOJI in weekly chart
The prices are below EMA
Let the prices go above 72.30
watch out for the price action

NCC At demand zone NCC trading at Weekly
Support Daily support
good time to enter with LOW RR
it may give breakout from weekly time frame

NCC ReversalThe stock has reached lower trendline and may undergo a reversal rally. Trade is supported by brokerage calls and Supports Nearby.
Risk Reward Ratio - 3:1
SL is placed below support zone & the lower trendline. The target is placed near resistance.

NCC Buy above 91.50, Possible upward trend, the trend possibly be reaching the target 113 by the end of November. positive indication of moving averages shows an upward trend.

NCC set for a rebound?LSE:NCC
Is the sell off here warranted? I am not so sure as there are 2 diverging activities here.
Initially from the 13th of September, the fall was looking justified with increasing volume on any new lower candles.
Yet this last candle has produced one of the highest volume days yet, trading within a smaller range than previously.
So I am now seeing increasing volume, on shorter bodied selling candles, telling me buyers are absorbing all the sell orders the market can throw at it.
Looks like a change in sentiment and this will go on my buy list for Monday.

NCC SWING LONGNCC has tested and consolidated a lot in the range of 70-90, its time for a sweet breakout. Target is 130

NCC - AnalysisWe can witness a symmetrical triangle in the Day chart of the NCC Stock. Current Market Price is at 90.45. The share has the potential to reach 100, which is roughly 10 points above the current price which will be around 11% upside.
If it breaks that level it will have the the potential to reach 115. There is a surge in the volume of this stock on Friday (11 June'21).
This is for educational purpose only

NCC - Up move resumes The NCC stock had previously peaked at around 100 levels in early February 2021. Since then, the stock was in a clear sideways/downward trend and had taken support multiple times at the 200 week SMA (currently near 74.5).
This week, NCC broke out of its range and closed at 88 levels. It also closed above the 2 recent resistance trendlines as shown in the chart (blue and red resistance TL). The stock is now in a clear up move and should head higher
Resistance/Target: The Feb 2021 high at 100 is the first clear resistance/target for this long trade. Once crossed, 2018 price levels of 110-130 will come into play. Any weekly close above 130 will lead to a big upside going forward.
Stop Loss: Maintain a WCB stop loss below 83


LONG TERM BUY IN NCC LTDjust stumbled upon this stock, very nice expanding flat in making in weekly chart for major buy.
look for it if you are looking for longer trades.
thanks
tc

NCC respected support levelNCC has supported channel pattern strong support level after triangle pattern breakout

