QQQs overbought conditions forces June SwoonQQQs has been a steadily forming this ascending triangle flag since early February as part of a 3 month corrective wave pattern (4th wave). It wont take long for this pullback to happen (June Swoon). Perhaps as early July we start to see the market bottom here around 325ish then breaking out to complete the cycle. Sometime around early to mid Sept we top out around 400ish then correct hard.
I'm still trying to figure out what can cause such a breakdown in the market. It is extremely likely that a CoVid wave hits the US once again due to the delta variant being strongly felt among young adults. I'm assuming the US will not hit herd immunity of 70% before flu season (October) and cases rise accordingly. More deaths in young adults. Some states shut down again? Who knows? The other is inflation data coming in hotter than expected and FOMC meeting in the end of Sept causes more deterioration in the market and Powell is extremely hawkish pushing the fed to raise rates sooner than expected as early as beginning of 2022 instead of end of 2022. Oof!
If both news data comes to fruition, I could see the QQQs back in the 250s. The fifth wave is complete and my count is wrong and we go back to 2015 highs. I hope only one bad data happens and we go in this long bull run in the markets for the super cycle.
NDQ


is Silver Still Contrarian?BIAS CHECK
this is my bias. I want to post for posterity's sake. We will know whether this was a good bet in the fullness of time. I suspect it will be, and this chart should give any silver n00b the perspective to persevere.
#silversqueeze


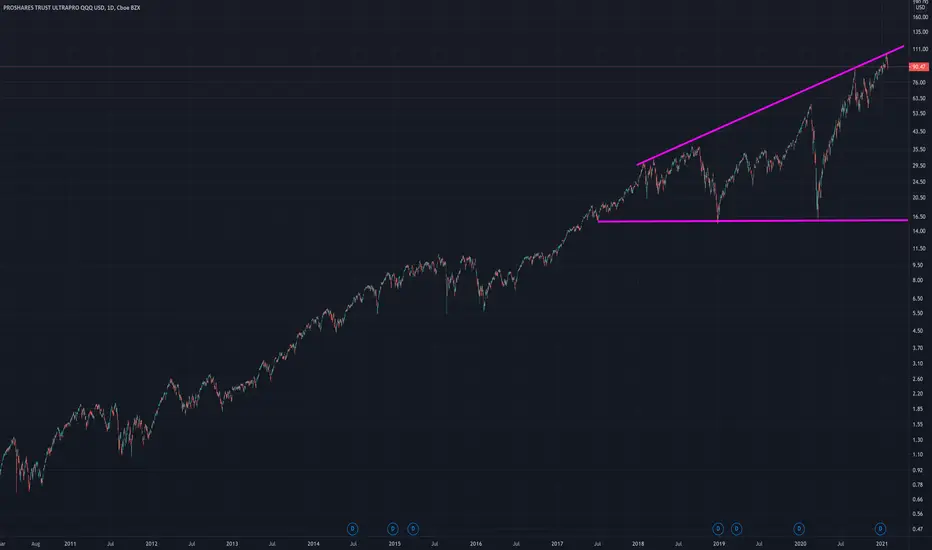
TQQQ - Ascending Broadening Right-Angled formation TQQQ - Ascending Broadening Right-Angled formation .
thepatternsite.com
Breakout is upwards in 55% of times.

Nasdaq 100- Ascendening Broadening Wedge Nasdaq 100- Ascendening Broadening Wedge (ABW)
Will remain in the ABW, until it doesn't.


Long on NASDAQ #NDAQNASDAQ:NDAQ
- MACD reversal
- Stock to re-enter in the channel $ 273.33- $133
- Entry $ 127
- First target $ 129.15
- Second target $ 133
- Stop loss $ 125.11


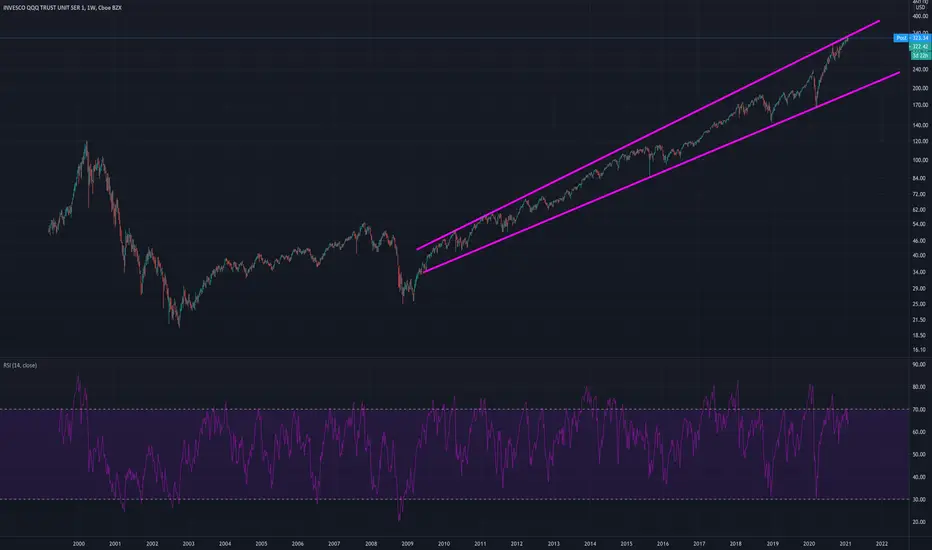
NASDAQ100- Big bust out confirmed?MASDAQ100 was in an uptrend channel since 2010.
Has busted out north of that uptrend channel and has confirmed what was once resistance is now support.
Looks pretty bullish, technically speaking.


NASDAQ waves - Compare to dot com - Completed final wave???Wave analysis all the way back to the beginning of NASDAQ (zoom out and pan around). Focus on last major motive wave sequence. If my analysis is correct, then it looks like the NASDAQ may be at the end of its run. Also, I added the final motive wave from the dot com bubble over the current motive wave. As you can see, the NASDAQ is currently a bigger bubble than dot com.
This is not trading advice. Enjoy and good luck.


Market Cycles - Waves and return to the mean - Part 7 S&P 500Here is the culmination of my last 4 months of technical analysis of the stock market. I looked at important growth stocks of the past and where they are today. From that analysis, I applied the lessons learned to todays market.
1) Growth stocks break out of the mean channel of wave 1 to finish wave 3 and 5. Average stocks stay in the mean channel.
2) The following correction will take them back to the project mean of wave 1, maybe even below. The more they break above the mean the more they drop during the correction.
3) Head and Shoulders pattern usually describes motive waves 4-5 and the following corrective ABC wave.
After a major correction several things can be learned
1) Some companies never really recover, assume they just had high prices because every company did (thing tech bubble)
2) Some companies recover but never become growth stocks again and grow but stay along a mean growth
3) Some companies are able to reinvent themselves and become growth stocks again (MICROSOFT)
I can't say I did everything correctly. I took my best shot at it and at the minimum gives a solid idea what could be to come for stocks in 2020 and beyond.
I broke this down in several idea posts.
Market Cycles - Waves and return to the mean - Part 1 GE
Market Cycles - Waves and return to the mean - Part 2 AT&T
Market Cycles - Waves and return to the mean - Part 3 IBM
Market Cycles - Waves and return to the mean - Part 4 MICROSOFT
Market Cycles - Waves and return to the mean - Part 5 GOOGLE
Market Cycles - Waves and return to the mean - Part 6 AMAZON
Market Cycles - Waves and return to the mean - Part 7 S&P 500
Market Cycles - Waves and return to the mean - Part 8 NASDAQ
Hope this helps and good luck.
