S&P 500 Waves - Up or Down the rest of the week???After yesterday's rally anything goes. The wave count could be 5 waves up or 3 waves up, both are viable. That long pin on the last candle hit 1.618 in a 3 wave, and if that is true then we are still in the corrective wave. I am still on the bearish side and expect more down. I am going with yesterday as a big short squeeze. The power of the Fed is hard to argue with as the results so far are amazing. Going to watch this play out.
Hope this helps and good luck trading.
NDQ

SPX (Derivative) vs. Inverted DXY + Upside & Downside TargetSomething pretty interesting happened when the DXY ( U.S. dollar index ) is inverted, and split chart next to the US500, a derivative of the SPX500 that trades within the construct of the OTCC markets and is a good 24/5 proxy. This being said, all of us in the FX market-- rather we like it or not-- are at the mercy of the SPX . The SPX is the most highly speculative instrument in the world. Speaking as someone who was complaining about the 12 year low ATR's the Euro was compressed to this time last year (July of 2018), I welcome the ability to trade speculation, at least there's some volatility we can get a bite at.
Can we can make more informed trading decisions for the U.K. and U.S. sessions as forex traders by paying attention to the equity market; or is it the other way around?
Just a theory.. should Trump resign--in a manner of 'dropping the mic-- with national polls suggesting Biden have over 10% leads in many very critical states for the entire Republican game plan. Now, if Pence takes over to fight Biden , I could care less to speculate; I will be here trading and making money regardless of who's president. What if..the market has been pumped by Pump and friends (Kulow, Mnchin, Powell), --and he essentially dumps.. that would make this just another pump and dump?

🩸 SPX Breaking 200-day MA 🩸 Today's selloff had many interrelated factors, of which came together to form what looks to be a hint of conviction, suggesting further price declines to the downside for most major benchmark's in the U.S. Most people who follow my SPX charts assume that every chart represents a new trade, specific in the time and moment. In reality, this isn't true and I use the SPX as a representation--even more so a manifestation-- of risk-appetite here in the U.S. Yes, there is a direct correlation between a market's range tightening, and the subsequent major moves to either the upside or downside. With the Dollar, it has shifted in what it represents. It's sensitivity to risk trends has improved. Looking at Emini futures over the DXY , we can take away it's not the only safe haven in the market. In fact, in more moderate terms--it's responsive in terms of risk-on, risk-off. A break below the 200-day MA for the SPX , can and should be joined by the Dax ( DEU30 ), with currently active shorts posted on my page over the last few weeks.

QCOM Massive Fractal Breakout5G architecture / devices rolling out to the end of the year. Tech as a whole heading to its second bubble. It would only make sense QCOM is one of the leaders of the rally.

Nasdaq100 daily- Little upside left, bearish RSI Nasdaq100 daily- Little upside left and nearing resistance, bearish RSI.

NAsdaq100 monthly Log chart: Up Channel Nasdaq100 monthly Log chart: Up Channel. Technical analysis doesn't have to be complicated.
Moral of the storey: Buy the dips (lower bounds of the channel) and stay long.

NASDAQNasdaq will probably have a retest to the downside before heading back up. A new resistance has been formed and in the new week, we will know how strong the resistance point it.

NASDAQ During fundamentals.... Watch to see possible entriesI have displayed a good entry point for a short and for a long. As a day trader, I go with the trend but also trade pull backs... I am neutral and waiting for an entry. VIEW TO SEE WHAT TO EXPECT

NASDAQ, stopped me out. Where is it going next ? Watch and seeMy personal thoughts on nasdaq direction, I am neutral at the moment because price is consolidation. Waiting for a break out of my box regions.

S&P 500 pattern 5.2 day up, 3 day down holds BUT warning signsYesterday morning's drop of almost 1% was very much not expected based on the previous day trading, but based on the clearly cyclic pattern of 5.2 days up and 3 days down it was right on the mark. If you have been following me, then you will see that I made an addendum yesterday morning (before trading) to note this on my Wednesday night analysis. I was caught off guard by how much it dropped in one hour, but I was able to added to my stocks purchases from the day before during that hour.
The pattern going forward though is not as clear. The very consistent 5.2 day up and 3 day down does not align with the end of the month. The end of March and end of April all aligned with sizeable drops. This time around it does not. I am not sure what the next 2 weeks hold. I laid out several different scenarios and timelines. I honestly don't know which it will be.
What is clear in this chart and my VIX and AD analysis, is that the market is changing. The VIX did not drop as much and spiked up more. The Advanced-Decline analysis pattern had some anomalies but overall held to form. Apple took a huge hit after almost 7 or 8 days up. It looks like the market maybe repositioning to different stocks given how overbought stock like Apple seem to be. I personally am bearish now and I am looking for a moderate down turn at the end of the month. I don't know how long lived it will be or how low, but something is coming.
The pattern of up and down for the S&P 500 since the bottom is as follows:
6.2 days up & 3.0 days down
6.2 days up & 3.0 days down
6.15 days up & 3.0 days down
5.2 days up & 3.0 days down
5.2 days up & 3.0 days down
Will the next rally be 5.2 days, 4.2 days, maybe even 6.2 days? Will the 3.0 days of selling change? Will be interesting to see.
The fact that the pattern is so precise is mind bending to me. If I was a conspiracy theorist, then I would say some large institution(s) is manipulation the market. But we should save that line of questioning for another day.
Please remember to take everything I say with caution and a block of salt. These are just my thoughts/ideas. Please use your own best judgement when trading. Good luck.

Bullish Bat - Wait for retrace to $17 then buyBullish Bat forming. Clearly oversold at the moment. Expecting a retrace to about $17 before buying. Take profit targets as shown.

What to do now with Nasdaq?Price is now kind of stuck in a symmetrical triangle pattern where it could hit either way, up or down. For it to go up higher, the price must close above 104.57 which I think it will.
Another possibility is it could also hit lower first before trending higher. That would means it would hit 102.85 as the first support. If this support level holds, then we can expect it to continue its upward trend.
The usual rules apply - the higher level you buy, you must be prepared for correction, which means suffering a temporary loss. Staring at your portfolio in the red is not a good feeling and that itself can make traders do illogical thing like cutting their loss only to see the next few days, it went the opposite direction.
So, if you want to buy, wait for it, don't just rush for it. Stay safe in the game!

Nasdaq 100- Long term support around 6500Long term log chart Nasdaq 100 index support around 6500 points, as arrowed.


NDQ- Bullish UpTrendNDQ- Short term, may test support of 20-day moving average (brown line). Currently price action is still above a rising 20-day moving average.
200-day moving average also nice health upTrend slop.

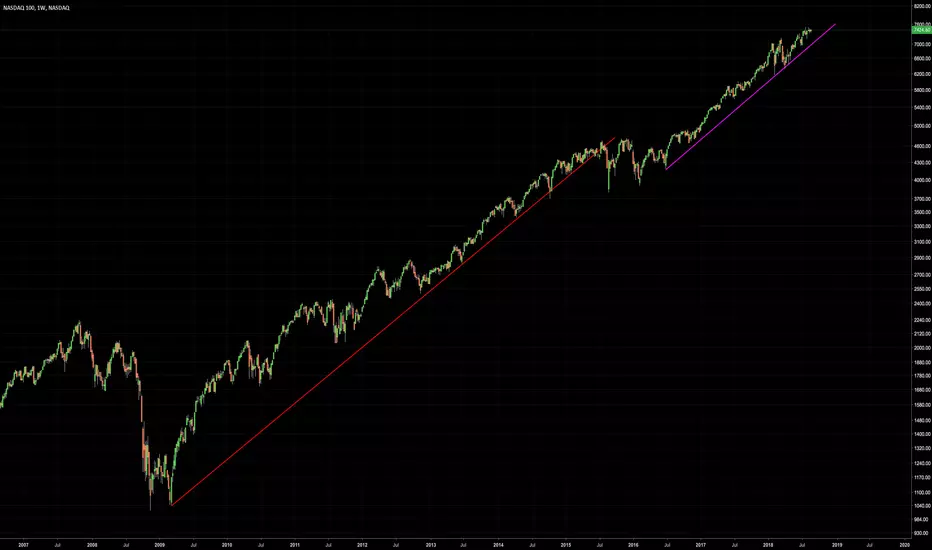
Nadaq 100 index (NDX) - Nice healthy UpTrend.Nasdaq100 index.
Healthy UpTrend. Red line since 2009 to 2015.
Sideways consolidation around 2015.
Pink UpTrend line from 2016-present.
NDQ: AAL American Airlines 28 day ascending triangle NASDAQ:AAL the 28 day ascending triangle is not a very strong trend that i will usually trade. There's a strong resistance at $40.47, if we manage to turn this resistance into support, I target at $44.13.
Stop-loss: $37.78
For safer entry, a break with confirmation above $40.47 will give a better risk reward.
A break below SL will nullify this bullish take.
