Inverted yields and odd weeksThis chart shows the periods with inverted 10y2y yields. Usually inversion doesn't lead to recession, like 2008. However the similarities with 2000 are striking. 3 Years ago we had a brief yield inversion, like in 1998. Then a second inversion occurred, bringing prices down with it. The same happens now. Half of the bubble burst occurred with yields inverted. Therefore it isn't necessary for yields to normalize for us to drop. We are in a bubble and it probably has burst.
And a less interesting part of the idea follows:
Yesterday some uninteresting-number-of-weeks candles closed. It was fun checking out where we are and how RSI reacts.
This has nothing to do with trading. I just love charts. I didn't bother with 1W chart because I consider it common.
In the following charts SPX is analyzed. I could post them in a new idea but got bored...
2W - we couldn't escape the ribbon, and RSI is flirting with its EMA. It is a tad lower than 50.
3W - RSI below its EMA and below 50.
4W - A bull trap on the price appears. But we are above the ribbon (for now?). RSI just barely above 50.
6W - A bullish engulfing or something? And then an inverted hammer appears.
Even though stochastic RSI reached the bottom, this doesn't mean that there is enough buildup to push RSI upwards. It takes two to dance/grow. Also EMA of RSI is helpful to me. RSI passing it provides me with an early signal of trend change.
9W - In this chart, the similarities to 2008 end. It resembles the .com bubble burst. It resembles the region just before the October 1998 rally. This one is less grim to the charts before. The candle however is a little mixed.
12W - Kinda bullish? I dunno... RSI made a higher low
18W - 2014-2022 stochastic RSI shows clear divergence. Stochastic producing lower highs, and with this candle it is confirmed.
36W - RSI and it's stochastic show a close similarity to September of 2000, the .com bubble burst.
Finally, I will add this DJI chart showing us where we are in history.
Let the drop commence I guess?
NDQ

NDQHELLO GUYS THIS MY IDEA 💡ABOUT NDQ is nice to see strong volume area....
Where is lot of contract accumulated..
I thing that the Seller from this area will be defend this SHORT position..
and when the price come back to this area, strong SELLER will be push down the market again..
DOWNTREND + Support from the past + Strong volume area is my mainly reason for this short trade..
IF you like my work please like share and follow thanks
TURTLE TRADER 🐢

IXIC , NDQ , NAZDAQ ANALYSIS , 1 WEEKI analyzed the Nasdaq index in the weekly time frame for you
If until the closing of the weekly candle, the power and body of the candle is as strong as possible
there is a high probability that the price will increase until Fibonacci 50%, and
then the price will drop sharply.

SPX | Trendline violationSPX has clearly violated a trend line of this Renko chart.
After a false-breakout of the channel, now we progress further downwards.
This chart may suggest that even though we have had consistent growth for the last years, every time we cover less and less ground upwards. The next leg up, may lead us to the bottom of the channel and a rejection. Only then we can understand some further stuff and see if this chart made sense in the first place. Maybe the meaning of this chart is nonexistent. Do however take a look at the other main indices.
DJI is performing better than the other indices this year.
NDX
I drew a shorter trendline, it made the most sense to do so.
SPX/PPIACO
We are just a 13.5% drop to get to the 2000 peak.
NDX/PPIACO
DJI/PPIACO
I did an automatic regression trend on it to make it more "official" looking. Notice that the 2008 bottom is an outlier in the trend.
In the SPX/PPIACO and NDX/PPIACO charts, I drew some trends that looked good to me at the time. Price seemed to get interested in these trends.
I just added a regression on NDX/PPIACO
Trust me, at the time I drew the trendlines, I drew them in a way that made sense to the price. And as you see the regression paints the same picture.
PS. Maybe we will enter the trend again sometime in the future. We probably will. As for now, he may have more pain ahead of us.
Tread lightly, for this is hallowed ground.
Father Grigori

DJI | Solid landNow we are in a thick moving sand. We need to drop much further to find solid land.
A way of looking at the clouds is as if they are mud. We are dropping as if we are very big, heavy and slow.
I have drawn some possible support levels. The upper 3 are taken from the DJI/M2SL ratio, and the bottom one is taken after we scale appropriately the GFC. We need to mind the speed, the size and the scale of this recession, to compare it with past ones.
All 3 areas taken from this chart, are in important fib retracements. The retracements are drawn with the magnet tool and are very accurate.
We are moving very fast downwards, so we could very easily collapse to 2008 levels.
Also take a good look at the DJI/M2SL chart. It clearly shows that:
For the past 20 years we haven't grown.
Right now we are in a level which is in the middle of the GFC.
And it feels like we are worse than in 2007. The M2SL comparison, transforms what we see (DJI price) to what we feel (DJI/M2SL). If you take a look at the charts I made regarding the true cost of energy, you will get a similar understanding of the tough spot we are in.
PS. You must pray.
Tread lightly, for this is hallowed ground.
-Father Grigori

Growth rises and falls faster and harderDo we see some relief into October?
Seems likely.. I think a possible test of the 50% retracement (another 2% downside) is possible..
Fundamentally, Macro seems bad, but forward looking, DXY rolling over, Oil already rolled over... It's possible a relief rally follows before another sell off EOY.
Similar charts with SPX and DJI

Market Update 9/29/22 Possible ReversalTIMESTAMPS:
________________________________________
Intro 0:00
APPL What I want to see 2:07
Quick DXY 5:15
Going Over APPL Price Movements 6:00
BTC 10:56
USD/WTI (OIL) 16:54
Closing Statements 19:11
________________________________________
Essentially I can easily see something bullish if we start between 142.65 - 143.2. I don't want the price to start too far away. Very similarly to how we started the day slightly under the Day 200 SMMA, touched it and then dropped. I go into specifics in the video.
Things look horrible and this is based on where we start on APPL tomorrow , but I have a good feeling about it. Also its not something that is traded until I see where we start the day, so pre and post are not important to me.
As always: Watch the video and I'll see you tomorrow at 09:15 EST to the end of the market.

NDQ - Possible scenario for a reboundWe might have a relief rally in the coming days. This is a possible scenario, however it is important to note that the big trend is to the downside.
SPX | GuillotineThe anatomy of these two bodies are identical. The murderer the same.
The "plateau" that was shaped in 2004-2006, is identical to 2018-2020
The chopped off head exactly the same.
Traders in 2008 had no clue (?) what would happen. (I doubt it, many knew very well what was happening)
Now that we have a direct counterpart, and a not so distant one, comes the question. Can we make it?
Was the 2008 crash a phenomenon of bad crisis management, or was it caused by a deeply rooted problem that rendered the crash inevitable?
A housing bubble then, a housing bubble now. Companies going bankrupt, and there are lots of them. And big companies close shops, change country of business etc.
Tread lightly, for this is hallowed ground.
-Father Grigori

Lower low for the S&P is in!In my post from yesterday I predicted a lower low for equities (and crypto). In this case the S&P 500 had made a lower low (crypto will follow soon). Expect more pain until new inflation numbers. Pre covid high could be a good buying opportunity for a bounce.

NDQ/NDX/IXIC | Exactly the same (except the blow-off top)Please read to the end, for a probable explanation that falsifies this one.
We are living the precise events that led up to the 2000 .com bubble burst and the subsequent 2001 recession. Now however, there was no blow-off-top event to make the two events identical.
Back in 1998, there was a "black swan" event, which was more apparent in DJI/SPX. This was caused by a crisis in Russia's economy. In 2019, a world-wide crisis caused the well-known crash. The progress after it is completely identical.
This can be further validated if you compare fundamentals. And also analyze DJI/SPX/NYA.
Much of the damage may have already occurred. But much more pain remains, perhaps immense. Germany is about to collapse (or already collapsed). Also war, food/water crisis, inflation, a destroyed production chain, are not ingredients for growth.
I am also adding this chart, which shows that probably the worst is coming, since it looks like we are barely falling.
PS. And now follows a conspiracy story:
Let there be a very rich man, who wants to be even richer. Since he is so wealthy, he could cause an earthquake. He would shake the box of economy, up and down at the time he pleases. And he confused the people, because the box of economy has taken a shape we all have seen before. In the era of information, who can't possibly see what is in front of him? Who on earth could not have possibly remembered the shape in front of them?
And as a different story said, everyone but a child could see the kings clothes (the king was nude).
And everyone feared, and sold everything they had to save themselves. And the rich man shook the box again and again, until it looked like we landed. And everyone thought that they were safe because it looked like it, and they bought again. And everything went up again. And the king was happy, because everyone saw his clothes, everyone followed him, and everyone bought when he wished...
And at the right time, he cracked the box and took your money. What an anticlimatic end to a story!
Tread lightly, for this is hallowed ground.
-Father Grigori

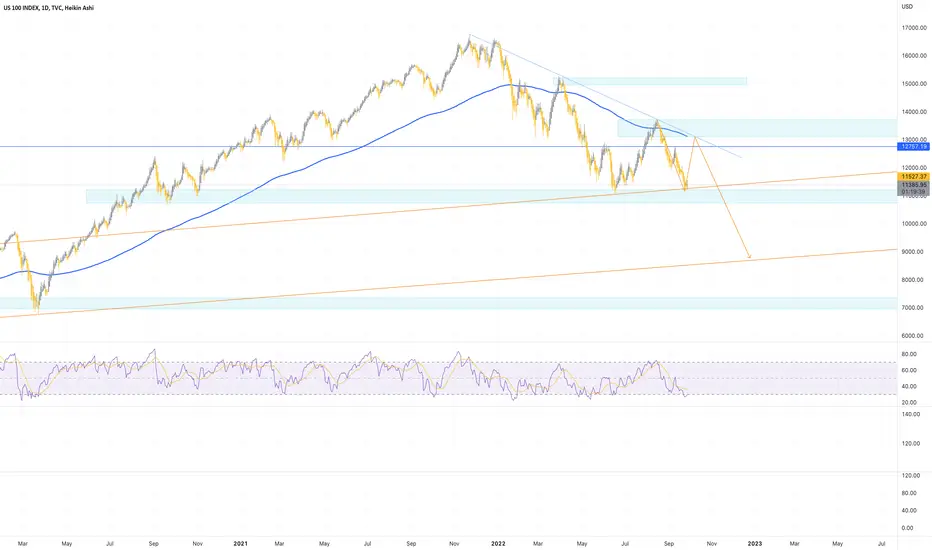
Weekly target on NASDAQWe will reach to 9000 area soon where it will be a good buy area .
But hold on !
We may also go to 7000 area .
Ill update you once we reach 9000 area what to do next stochastic weekly in bearish way and the bottom maybe far

Market Update 9/22/22Intro 0:00
BTC 0:30
APPL 2:18
VIX 11:51
HSI: 14:45
XRP/BTC and BTC Analysis 16:10
I refer between VIX, APPL and BTC in-between 11:51 and 14:45
I go over where I expect things could start for movements tomorrow and then I go in to what happened today and why I think we can end up at certain places and what targets bulls and bears may be fighting for to get what they want. Non-Short-Term Bears don't always want to sell nor do similar bulls always want to buy. Consolidation can be key.

Market Update 9/21/22Time Stamps:
0:00 APPL
4:00 VIX
6:28 APPL
9:12 BTC
18:02 ETH/BTC
19:06 GOLD
19:24 OIL
Lets see what happens.
I go over what I want to see then a recap of the last couple days and today and then I go over BTC towards the end and the big trend we have been in for months.
Long story short, I hope we get bought up a small amount tomorrow so that we can have a clean break further down and it wont seem like we are getting oversold. Though, I can't be annoyed by anyone selling because they want to be in in cash. It just makes sense as a defensive option. So to that, we may just fall off a cliff. I really don't mind being oversold though, as I prefer being bullish on/after big drops.
To me, the indexes have no real support underneath where they currently are and if APPL drops, It will drag things down pretty far. I expect Appl to head towards 122 in the near future, but well have to see what happens. Appl around 22 would coincide with the indexes possibly hitting around 20-38% down, which isn't bad considering there could be a nice amount of overselling and an easy ride back up like we had in 2020.

Stock Indexes At Major SupportsAll major stock indexes including NASDAQ100 S&P500, NASDAQ Composite, and Russel 2000 are at the bottom of their uptrend channels.
They could all break down, but it seems very unlikely as all asset managers are significantly bearish going into support. When we finally rally these guys are going to be force buyers the whole way up. Initial jobless claims are trending down since its peak in July. PPI which leads CPI has also dropped significantly the last two months. Asset managers are betting on a recession that isn't coming. The Fed hikes rates into a strong economy. They drop rates in a weak economy. When you see the Fed pause hikes and consider dropping rates, that's when you get scared.
All we need now is something positive to happen.

Market Update/Outlook 9/20/22I am pre-positioned in a small size of OTM puts incase the vix looks bad, affects the premarket tomorrow and I cannot position properly. The places I would get out or where I would add on at, are mentioned in the video.
Its too much work to find them all and type them all, so just watch the video.
Cya all tomorrow at 9:15 EST for the full market day.

Market Rotation from risk to safety.1st Vertical Line in bottom two charts show risk assets peaking such as Nasdaq and Bitcoin while the top two charts suggest a bottom confirmation by both US dollar and US 10 year treasury bills.
Horizontal line shows major penetration of support and/or resistance for all four charts. Penetration to the upside for top 2 charts, while penetration to the downside for risk assets.
2nd vertical line marks the point of penetration for support and/or resistance.
Why the strong correlation?
Market rotation from risk to safety and there's no other way to buy US treasury bills than to pay with US dollars.

Market Update 9/16/22 Bullish Weekend!?Watch the video. There is a lot of good stuff here. It looks like we will have a good week.
I stream every Week day from 09:15 to 16:15 EST and Sundays at 19:30 EST (30 minutes before the Week-Candle change.

Market Update 9/15/2022Tomorrow I will put all of these into one idea and only update that, so you all will see everything in one spot. Sorry for making it difficult (People on tradingview).
Watch the video. The key parts are important and should not be ignored. This is not a video about appl, but the whole market and BTC.

NDQ100 NDQ on Dailly Time Frame.
We can retest on the support line .
#DYOR
I am not responsible for any kind of loss or profit.\
For Educational purpose only . TVC:NDQ


SPX Key Macro Levels and areas of S/R all the way down.A clear TA layout of likely areas of interest over the next six months. Use this to help play the levels on Bitcoin and Ethereum. Yellow = 50MA Blue = 100MA Red = 200MA. Good luck.
- W.S.

Soft Landing ???A Head and Shoulders is probably forming on decreasing volume. Or maybe it will evolve in a bear flag, who knows?
We are still below the downwards trendline.
If H&S doesn't form, well, I'm wrong again...
See you on the weekend of 24-25 of September. Only then we will find out.
I hope the guy in German parliament is talking about financial collapse and not nuclear war.
GLHF
