QQQ (+ QLD, TQQQ) , Stay heavy on positionsQQQ (+ QLD, TQQQ) , Stay heavy on positions
Despite downside volatility, the trend remains intact. I’m maintaining the same view as before—this is still a zone to stay heavy.
NDQ100
NDX & SPX , Stay heavy on positionsNDX & SPX , Stay heavy on positions (QLD, TQQQ)
Market sentiment is currently tilted toward betting on downside volatility, which ironically supports the case for the stock market to continue its upward trend.
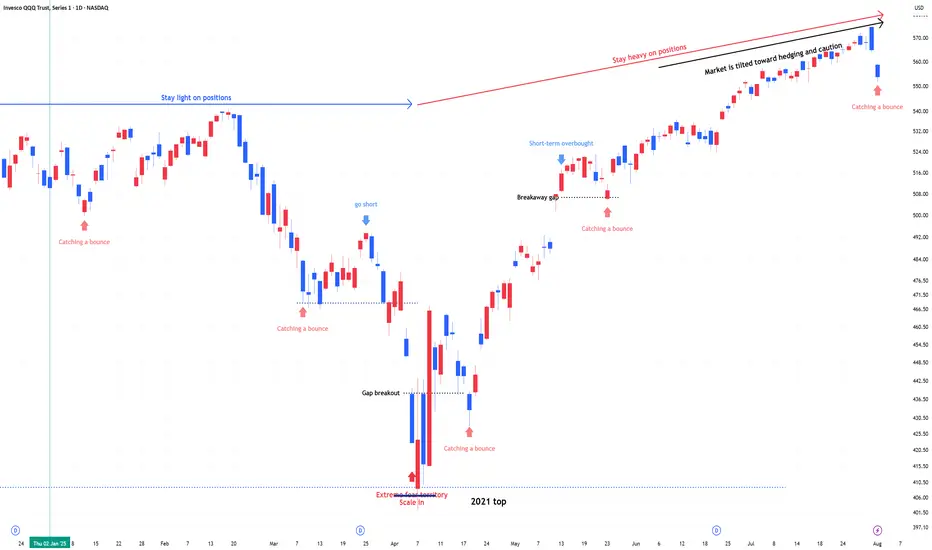
US 100 (NDQ) : Stay Heavy on PositionsApril Fear & Buy Signals
In early April, the Nasdaq 100 experienced a sharp sell-off, triggering extreme fear sentiment across the market.
At that point, scale-in buy signals appeared—classic "buy the fear" conditions.
Markets swing between greed and fear—unless the whole country collapses. Right now, greed is taking the lead, but the real blow-off top volatility hasn’t even started yet.
Stay Heavy on Positions
Despite short-term uncertainty, I’m maintaining an overweight position on the Nasdaq 100.
As long as we don’t see a major breakdown, the bias remains bullish.

NVIDIA: Stay heavy on positionsNVDA position size is adjusted in line with US market signals for underweight or overweight allocations. During panic phases, 2x leverage ETFs are on the table
Stay heavy on positions.

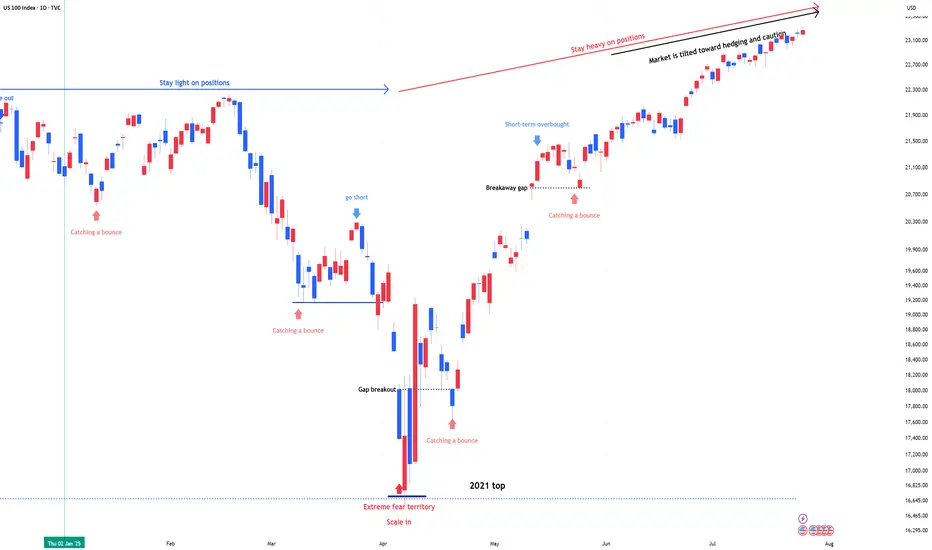
US 100 (NDQ) : Stay Heavy on Positions1) April Fear & Buy Signals
In early April, the Nasdaq 100 experienced a sharp sell-off, triggering extreme fear sentiment across the market.
At that point, scale-in buy signals appeared—classic "buy the fear" conditions.
2) Current Market State: No More Fear, but Watching
Since then, the market has stabilized.
The fear has disappeared, but we are still in a wait-and-see mode as traders assess the next move.
Momentum is holding, but participation remains cautious.
3) Stay Heavy on Positions
Despite short-term uncertainty, I’m maintaining an overweight position on the Nasdaq 100.
As long as we don’t see a major breakdown, the bias remains bullish.
#NDQ - Weekly Targets 23197.39 or 21886.08 ?Date: 03-07-2025
#NDQ - Current Price: 22641.89
Pivot Point: 22541.74 Support: 22335.83 Resistance: 22748.58
#NDQ Upside Targets:
Target 1: 22832.49
Target 2: 22916.40
Target 3: 23056.89
Target 4: 23197.39
#NDQ Downside Targets:
Target 1: 22251.45
Target 2: 22167.08
Target 3: 22026.58
Target 4: 21886.08

Stock Markets Rise Amid US–China Trade Deal ProgressStock Markets Rise Amid US–China Trade Deal Progress
As the chart shows, the Nasdaq 100 index (US Tech 100 mini on FXOpen) formed a bullish gap at Monday’s market open and, as of this morning, is trading at its highest level since early March.
This is driven by the announcement from the Trump administration of progress in securing a trade deal with China, following weekend negotiations held in Switzerland. Treasury Secretary Scott Bessent described the two-day talks with Chinese officials in Geneva as “productive”, adding that more detailed information would be shared on Monday.
As a reminder, the US imposed tariffs of 145% on Chinese goods, to which Beijing responded with a 125% levy on American imports.
Technical Analysis of the E-mini Nasdaq 100 Chart
The chart is showing bullish signals:
→ The downward trendline (shown in orange) was broken around the 19,666 level, which has since acted as support (indicated by the blue arrow).
→ Today, the Nasdaq 100 has moved above last week’s resistance near the 20,175 level.
→ Market fluctuations are forming an upward channel (shown in blue) from the April lows, with the price currently sitting in the upper half of the channel—typically a sign of strong buying pressure.
Further updates on the US–China trade deal may reveal key details, potentially reinforcing the current bullish sentiment in the equity markets.
This article represents the opinion of the Companies operating under the FXOpen brand only. It is not to be construed as an offer, solicitation, or recommendation with respect to products and services provided by the Companies operating under the FXOpen brand, nor is it to be considered financial advice.

NASDAQ a look ahead...As the NASDAQ and other major U.S. Equity Indexes face the pressure of economic uncertainty, the price action between days show that investors are not quite convinced this bull run has seen its finish line. However, we shouldn't only be looking toward private investor sentiment, but also that of the Federal Reserve's presence in the market and how the bond market reflects the Fed's position moving forward.
As shown here, the all time high for the TVC:NDQ is $22,133.22. Our position is that the NASDAQ must reclaim, retest, and continue beyond the all time high in order for us to continue our confirmation on the bull run. The path described should look as shown below...
In this instance, we can assume the bull run should continue. However, we should also be prepared for an alternate scenario where investors leave risk assets behind to chase non-risk assets (bonds for example). This scenario would look as shown below.
All though these are not the only two possible scenarios, we can most likely expect the future to play out in a similar fashion as the examples.
As for the market metrics to keep an eye on, look to TVC:US10Y for any bond yield manipulation, FRED:RRPONTSYD for market liquidity metrics, and FRED:M1V for M1 money velocity. Furthermore, keep an eye on tariffs for consumer tech ( NASDAQ:AAPL , NASDAQ:NVDA , NYSE:TSM ) and military activity ( NYSE:LMT , NYSE:RTX , NYSE:NOC ). Lastly, keep an eye on the banking and financial sector for more than likely banking deregulations withing the coming years.

Actionable Nasdaq insights: 11-APRIL-2025Rise and shine, traders! Start your day with actionable Nasdaq insights. Let's grow your skills together, one chart at a time.

Rate Cuts Coming Up?Simply put, yes , the Fed has appeared to switch its position on the FRED:FEDFUNDS remaining flat and are expecting further rate cuts. So what can we hypothesize the market's reaction will be? Well, you guessed it, the market will probably like the news and cash will flow into "risk-on" assets including crypto assets and, of course, stocks. Furthermore, we can infer that the market is not currently pricing in any rate cuts and we have yet to see a TRUE correction specifically in the TVC:DJI , TVC:NDQ , and the $SP:SPX.
The image above shows an example of the 200 EMA significance and how it can be used to buy the dip at the right timing. PLEASE do not try to buy each top and bottom as it's virtually impossible to perfectly time the market. However, it should be suggested that you buy the day after the underlying bounces off the EMA. This is the most effective way to avoid a "fake out" in the trend. When this EMA it touched and rebounded, it could imply that a correction has taken place and that momentary downtrend is about to reverse to continue its previous bull trend. This could look as shown below.
Just because it is shown on the chart doesn't make it so. Please keep in mind an equal and opposite possibility, where the EMA is broken through and a Bear market begins. Even though the odds for this are less than likely, the market simply not getting a rate cut could lead to this situation becoming a reality. In this market, nothing is impossible so be ready for everything.
In conclusion, prepare for rate cut from not only the Fed, but ECB, and Bank of England as well. With this, we can expect rising markets as cash moves its way into risk assets. However, no one is a visionary, so if the markets don't get what they want (and we all know that it wants rate cuts more than anything), expect a lowering market and prepare to exit positions until a rebound appears reasonable.

Nasdaq analysis: 30-Jan-2025Good morning, everyone! Today's Nasdaq analysis is designed to educate and empower. Use these insights to refine your price action trading strategy.

Actionable Nasdaq insights: 29-Jan-2025Rise and shine, traders! Start your day with actionable Nasdaq insights. Let's grow your skills together, one chart at a time.

Nasdaq analysis: 16-Jan-2025Good morning, traders! Today's Nasdaq analysis will help you achieve your trading goals. Let's work together towards success.

Nasdaq analysis: 07-Jan-2024Good morning, everyone! Today's Nasdaq analysis is designed to educate and empower. Use these insights to refine your price action trading strategy.

Nasdaq market analysis: 06-Jan-2025Good morning, traders! Welcome to today's Nasdaq market analysis. Compare my price action insights with your own charts and enhance your trading skills.

NDQ - Descending Triangle? Or Bull Flag?I see a descending triangle pattern with the next potential support level at 21,161.
Please cast your vote in the comments as to whether you think it's a Descending Triangle, bull flag or something else?
Let me know if you have other thoughts...

$NDQ short potential TVC:NDQ could be building bearish momentum after weeks of aggressive bull run. We might see a correction to 21,263 if 21,623 holds. The best entry for shorts would be 21,543

Nasdaq analysis: 06-Dec-2024Good morning, trading community! Today's Nasdaq analysis is for you. Share your thoughts, ask questions, and let me help you grow.

Nasdaq analysis: 05-DEC-2024Good morning, everyone! Today's Nasdaq analysis is designed to educate and empower. Use these insights to refine your price action trading strategy.

Beautiful Bull Pennant on NDQ 4 hrLooking at a beautiful Bull Pennant on NDQ 4 hr. Looks to be breaking out of the upper trend line now. Keeping a close eye on this one.

S&P 500 Index SPX To Rally FurtherThe S&P 500 index SPX is just 50 points away from breaching the previous all-time high.
The minutes of the Fed’s July 30-31 meeting, released Wednesday, said the “vast majority” of policymakers “observed that, if the data continued to come in about as expected, it would likely be appropriate to ease policy at the next meeting.”
Traders had already considered it a certainty that the Fed will announce its first interest rate cut in four years when it meets in mid-September.
SPX next targets: 5680 - 5825.

Nasdaq - We still have to be careful!TVC:NDQ is still retesting resistance after we just saw an expected rally of +75%.
More than a decade ago, the Nasdaq entered one of the most profitable and easy to trade patterns: a rising channel formation. In the beginning of 2023 the Nasdaq once again retested the lower support trendline in confluence with a retest of horizontal support and continued its bullrun from there. But currently resistance is ahead so we have to be quite careful and properly monitor price action on the smaller timeframes.
Levels to watch: $19.000, $16.000
Keep your long term vision,
Philip - BasicTrading

$Nas100 TRADE IDEATVC:NDQ is poised to drop lower to 19,132 for a 50% correction after yearly ATH expansion. With US CPI in view, this seems likely to play out between London and NY session close today
