QQQ/NASDAQ STOCKS 200 DAY AVERAGEHi,
I love using ratios. Great tool to explore if something is overvalued or undervalued.
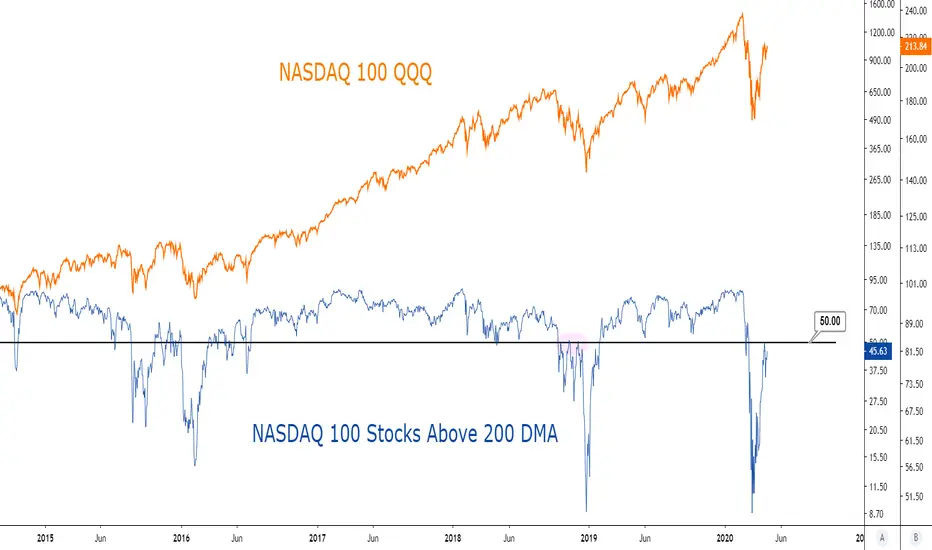
All know what QQQ is.
NDTH is Nasdaq stocks percent that are above 200 day average
QQQ/NDTH shows you if market is excited or scared.
At the moment people are FOMOing which is never a good sign.
I will act as per diagonal line. Will update when this is above 18. Thats propably where I will buy again.
You may apply same to SPX/S5TH for SP500
Long story short,
I expect Nasdaq to drop.
NDTH

NDTH looking for some reliefThe NDTH is a chart of the percentage of Nasdaq 100 stocks that are above their 200-day moving average.
This chart, although looks like driven by fundamentals - has created perfect tops and bottoms to be able to chart it. We have re-touched the bottom on the midterm and value is still withing this descending channel - but all looks like in favor of some relief by breaking out to the upside. More companies from NASDAQ index could go above their 200-day ma before going finally down again.