NASDAQ rebounding strongly on its 1D MA50. 1 month rally ahead.Nasdaq (NDX) has been trading within a 4-month Channel Up and hit last Tuesday its 1D MA50 (blue trend-line) exactly on the Channel's bottom. Even though it marginally broke it, the 1D candle closed exactly on the 1D MA50, causing a strong bullish Friday reaction.
As today opened equally green, we technically view this sequence as the start of the new Bullish Leg of the pattern, which may be confirmed today if the 1D RSI breaks above its MA (yellow trend-line), as both previous Bullish Legs did.
Our Target is 22600, which represents a +9.00% rise, the minimum a Bullish Leg had within this Channel Up.
-------------------------------------------------------------------------------
** Please LIKE 👍, FOLLOW ✅, SHARE 🙌 and COMMENT ✍ if you enjoy this idea! Also share your ideas and charts in the comments section below! This is best way to keep it relevant, support us, keep the content here free and allow the idea to reach as many people as possible. **
-------------------------------------------------------------------------------
💸💸💸💸💸💸
👇 👇 👇 👇 👇 👇
NASDAQ 100 CFD

SPX PRICE ACTION JAN05 2025Welcome to SPX weekly. I have discussed in depth price action of SPX and if you have any doubts feel free to leave a message or comment below.
NOTE:BE CAREFUL IF YOU ARE LONG

NASDAQ Double Bottom starting the new bullish waveNasdaq / US100 is trading inside a 5 month Channel Up.
The price made a Double Bottom on January 2nd and rebounded today back to hit the 4hour MA50.
If it crosses above the Falling Resistance, we will have a technical confirmation of the new bullish wave, similar to September 12th 2024.
That bullish wave hit the 1.236 Fibonacci extension.
Buy and target 22400 (Fib 1.236).
Previous chart:
Follow us, like the idea and leave a comment below!!

Nasdaq Zones: 03-Jan-2024Rise and shine, traders! Start your day with actionable Nasdaq insights. Let's grow your skills together, one chart at a time.

🦘🦘 Aussie Kangaroo Returns Home In The OutbackThe Australian dollar has been taking a bath. It’s gone from buying 71 US cents at the beginning of the year to netting you just 63.3 US cents against the benchmark greenback.
The dollar is down over the last year against most currencies, and down over the past few weeks against almost every currency.
The humble Aussie dollar is suffering in particular against European currencies: Pound Sterling, the Swiss Franc and the Euro.
However, even in Japan where the AUD is up over the year so far, it is down in recent weeks.
What’s going on? The answer is two-fold.
👉 America’s economy is stronger than expected. And China is weaker, so Chinese yuan has little to no chance of dethroning the US dollar, even as global de-dollarization happens.
👉 Australia gets hit on both of those trades.
Difference between 10-Year United States and Australian Govt Debt becomes lower
Technical graph for FX:AUDUSD indicates that Aussie has a lot down to deliver.

2024 is a wrap - time for 2025 outlook - let's go2024 will be a memorable year
-23% gains
-Mag 7 + Semiconductors + Bitcoin all contributing nicely
-PLTR was the top performing stock in the S&P 500 (impressive 340.48%)
As always, 2024 wasn't in a straight line up, though it felt like it at times
VIX had #1 and #2 largest single day moves ever (Aug 5 and Dec 18)
April was a sticky inflation pullback month
August was a Bank of Japan deleveraging weekend scare
FED dominated the catalysts with guidance, narrative, and wait and see between employment and inflation data
2025 will bring new president, new policy, new Republican power. Many were excited about this but there are still checks and balances and markets need more reassurance than hyperbole. I plan to look at income plays and trading plays were buy and hold. Whatever I do own equities and ETFs wise, I want protection just in case the market isn't as straightforward and bullish like it has been since Oct 2022.
Happy New Year - thanks for watching!!! See you in 2025!!!

NASDAQ 100 index / US 100 outlook Based on the previous week rejection of the 21742.33 zone, I'm anticipating price to come back to 21610.60 which is my daily point of interest for sell continuation (a pullback os anticipated) taking the Monday high as Inducement. But I'm looking forward to catching the pullback with the H4 POI: 21045.73 , yesterday's low as Inducement hence buying till we reach my daily poi before the sell continuation.
What's your outlook on this.
Comment let's interact
Don't forget to follow to get notifications of I drop my outlooks.

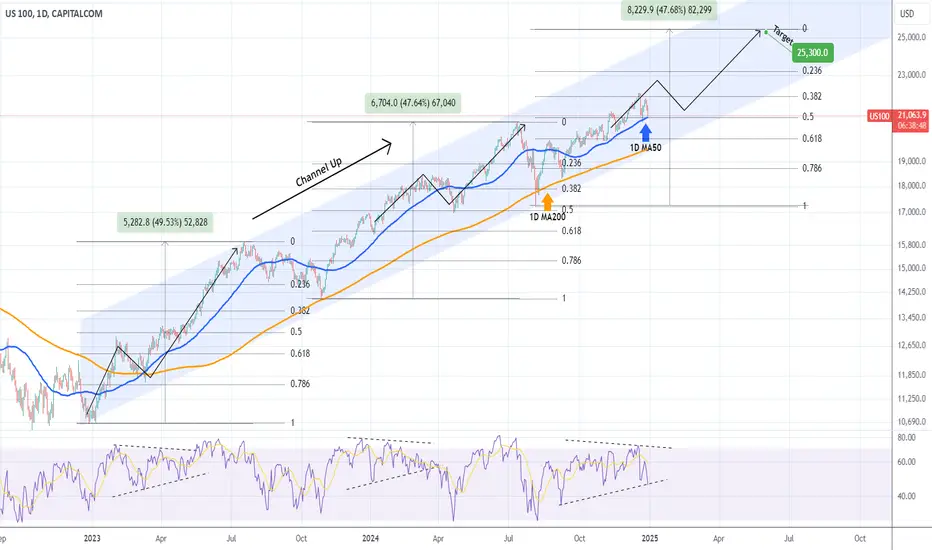
NASDAQ headed into a volatile January but uptrend remains intactNasdaq (NDX) is yet again testing the 1D MA50 (blue trend-line) following the direct hit of December 20. Despite the pull-back, it is technically respecting the 2-year Channel Up that it's been trading in since the December 26 2022 market bottom. Its most recent Higher Low was on the August 05 2024 1W candle, which initiated the Bullish Leg we're currently in.
Until we get a 1W candle closing below the 1D MA200 (orange trend-line), the pattern remains intact and the strategy is to continue buying into the current Bullish Leg. The previous two Bullish Legs had one main pull-back/ correction sequence each and apart from that, the majority of the Leg was technically a straight uptrend. Given that the current Bullish Leg has been trading above its 1D MA50 since September 12, it is not unlikely to see a correction below it.
Technically, it could be similar to the previous Bullish Leg (March 04 - April 15 2024), as we are trading within the 0.382 - 0.5 Fibonacci range. This means that one more rise above the 0.382 Fib is to be expected in the first week of January but it is likely to then see a correction for the rest of the month below the 1D MA50 into the first 2 weeks of February.
If after that, the 0.5 Fib and 1D MA200 levels hold, we expect the Bullish Leg to resume the uptrend and target 25300. That would be a rise of around +48%, which is the % rise of both previous Bullish Legs.
-------------------------------------------------------------------------------
** Please LIKE 👍, FOLLOW ✅, SHARE 🙌 and COMMENT ✍ if you enjoy this idea! Also share your ideas and charts in the comments section below! This is best way to keep it relevant, support us, keep the content here free and allow the idea to reach as many people as possible. **
-------------------------------------------------------------------------------
💸💸💸💸💸💸
👇 👇 👇 👇 👇 👇
NASDAQ: Technical pullback presenting a buy opportunityNasdaq got oversold on 1H due to the strong selling on opening but remains neutral on its 1D technical outlook (RSI = 51.372, MACD = 205.380, ADX = 49.545) as it is still over the 1D MA50. More specifically, it was the rebound on the latter last Friday (Dec 20th) that has initiated the current bullish wave. This is the 5th bullish wave inside the 5 month Channel Up and as long as the 1D MA50 continues to support, we are expecting a new High. As with the prior Highs, we are targeting the 2.382 Fibonacci extension (TP = 22,550).
See how our prior idea has worked out:
## If you like our free content follow our profile to get more daily ideas. ##
## Comments and likes are greatly appreciated. ##

QQQ Nasdaq 100 ETF 2025 Prediction - My Top 10 PicksIf you haven`t bought the recent dip on QQQ:
My price target for QQQ in 2025 is $608, driven by the following fundamental factors:
Strong Growth Potential in Technology:
The QQQ ETF is heavily weighted towards technology companies, which are at the forefront of innovation and growth. Major constituents like Apple, Microsoft, and NVIDIA are not only leaders in their respective fields but are also expected to benefit from ongoing trends such as artificial intelligence, cloud computing, and digital transformation. Analysts project that the earnings growth for QQQ constituents will outpace that of broader market indices, with estimated one-year earnings growth rates around 17.31%. This growth trajectory supports a bullish outlook as these companies continue to expand their market share and profitability.
Favorable Macroeconomic Conditions:
Recent Federal Reserve actions, including interest rate cuts, create a conducive environment for growth stocks. The Fed's dovish stance is likely to lower borrowing costs and stimulate investment in technology sectors. As interest rates decline, the present value of future earnings increases, making high-growth tech stocks more attractive. The anticipated economic recovery and stabilization should further enhance investor sentiment towards QQQ.
Historical Performance and Resilience:
Historically, QQQ has outperformed the S&P 500 in bull markets, showcasing its resilience during periods of economic expansion. Over the past decade, QQQ has delivered an average annual return of approximately 18.59%, significantly outpacing many other investment vehicles. This historical performance suggests that as market conditions improve, QQQ is well-positioned to capitalize on renewed investor interest in growth stocks.

Will AMD recover and catch up with NVDA? updated/Revised Outlook🔸Hello traders, today let's review 2days/candle price chart for AMD.
Price contained within bullish channel since 2021, however currently
pullback/correction in progress.
🔸65% correction in progress, based on previous swings expected to complete at/near 88/90 USD in Q1 2025. Until then it's recommended to stay out.
🔸Once we bottom out near 90 USD in Q1 2025, expecting bullish swing 265% gains off the lows, so projected high is 310/320 USD.
🔸Recommended strategy bulls: Bulls wait for correction to complete at/near 85 usd in Q1 2025 and get ready to BUY/HOLD. Bullish impulse / reversal off the lows price target based on measured move projection is 310/320 USD. patience required, do not expect miracle/overnight gains in this market. good luck!
🎁Please hit the like button and
🎁Leave a comment to support our team!
RISK DISCLAIMER:
Trading Futures , Forex, CFDs and Stocks involves a risk of loss.
Please consider carefully if such trading is appropriate for you.
Past performance is not indicative of future results.
Always limit your leverage and use tight stop loss.

NASDAQ Technical buy on this 1D MA50 bounce.Nasdaq (NDX) has been trading within a Channel Up pattern since the September 06 Low and potentially has started the new Bullish Leg as on Friday it hit the 1D MA50 (red trend-line) and rebounded. The 1D MA50 has been holding since the September 12 bullish break-out.
Still, there is no confirmation yet, as the price remains below the 4H MA50 (blue trend-line). As you can see on this chart, every time the index broke above its 4H MA50, it never broke again until the next Higher High of the Channel Up, technically confirming the new Bullish Leg.
With the 4H RSI rebounding also from oversold (<30.00) territory, there are higher probabilities of this being the new Bullish Leg. If the confirmation comes, we expect at least another +9.08% rise from Friday's Low (which was the % rise of the previous Bullish Leg) to target 22500.
-------------------------------------------------------------------------------
** Please LIKE 👍, FOLLOW ✅, SHARE 🙌 and COMMENT ✍ if you enjoy this idea! Also share your ideas and charts in the comments section below! This is best way to keep it relevant, support us, keep the content here free and allow the idea to reach as many people as possible. **
-------------------------------------------------------------------------------
💸💸💸💸💸💸
👇 👇 👇 👇 👇 👇

Nasdaq market analysis: 23-Dec-2024Good morning, traders! Welcome to today's Nasdaq market analysis. Compare my price action insights with your own charts and enhance your trading skills.

NDX Is Very Bearish! Sell!
Take a look at our analysis for NDX.
Time Frame: 9h
Current Trend: Bearish
Sentiment: Overbought (based on 7-period RSI)
Forecast: Bearish
The market is approaching a significant resistance area 21,287.68.
Due to the fact that we see a positive bearish reaction from the underlined area, I strongly believe that sellers will manage to push the price all the way down to 20,340.94 level.
P.S
The term oversold refers to a condition where an asset has traded lower in price and has the potential for a price bounce.
Overbought refers to market scenarios where the instrument is traded considerably higher than its fair value. Overvaluation is caused by market sentiments when there is positive news.
Like and subscribe and comment my ideas if you enjoy them!

NDX positive move for the next two days.Riding the Nasdaq Wave: Navigating Market Swells and Dips
Let’s dive into the Nasdaq 100 Index. Flashback to a year ago, and you'll remember a 4.05% dip from December 28, 2023, to January 4, 2024. Technology stocks took a hit, shaken by rising interest rates. The market trembled under hawkish whispers from Federal Reserve officials, who hinted that rates might stay elevated to tame inflation. This stirred up volatility, causing a sell-off in high-growth tech stocks — notoriously sensitive to interest rate ripples.
Fast forward to today, and we’re staring down a similar barrel: fewer interest rate cuts in 2025 and pesky inflation hanging around. Technically, the NDX boasts solid support at around 21,000. It would take some seriously bad macro-news to dip below the 50-day moving average. Expect some range trading between 21,000 and 22,000 this week.
For traders, the game plan mirrors that of the S&P 500 Index. Pocket some profits during market highs and keep some cash handy for snagging better deals in 2025. Stay sharp, and ride the wave!

SPX 2025 Strategic Outlook 7150 points Wave Five Bull Market🔸Time to update the SPX outlook, this is 2D price chart, we are
currently entering overpriced zone and limited upside in SPX
going forward next few weeks correction / pullback.
🔸SPX price structure since 2023 is defined by a five wave impulse wave 3 completed already and currently we are in wave 4 pullback/correction until 5415 points. expecting wave four pullback to complete in January 2025.
🔸Wave 1 is 3600 to 4625, wave two 4625 to 4125, wave three 4125 to 6100,wave 4 pullback/correction now is 6100 to 5416, final bullish wave five is expected to start from 5415 to 7150 points (30% bull run). Wave 5 expected to start in January 2025 and complete sometime in Q4 2025. A/B/C 40% correction will follow as the market will enter extremely overbought zone.
🔸Recommended strategy position traders: wait for the wave 4 correction to complete at/near 5415 points in January 2025 and then BUY/HOLD into wave 5 final target is 7150 points in Q4 2025. Obviously, this is a longer BUY/HOLD trade setup and patience is required with this trade. good luck!
🎁Please hit the like button and
🎁Leave a comment to support our team!
RISK DISCLAIMER:
Trading Futures , Forex, CFDs and Stocks involves a risk of loss.
Please consider carefully if such trading is appropriate for you.
Past performance is not indicative of future results.
Always limit your leverage and use tight stop loss.

Nasdaq analysis: 20-Dec-2024Good morning, traders! Today's Nasdaq analysis will help you achieve your trading goals. Let's work together towards success.

Nasdaq 100: Make-or-Break Trendline SupportChart Analysis:
The US 100 Index has pulled back from recent highs but remains above its rising trendline (black), maintaining the broader bullish structure.
1️⃣ Rising Trendline:
The trendline, originating from the August lows, has been a key dynamic support for the index. Price is currently testing this level around 21,150, making it a critical area to watch.
2️⃣ Moving Averages:
50-day SMA (blue): The index remains above the 50-day SMA at 20,818, confirming short-term bullish momentum.
200-day SMA (red): Positioned at 19,438, reflecting a long-term bullish trend.
3️⃣ Momentum Indicators:
RSI: At 51.88, signaling neutral momentum, giving room for the index to either bounce or consolidate further.
MACD: The MACD line has turned downward, suggesting weakening bullish momentum but no decisive bearish crossover yet.
What to Watch:
A bounce from the trendline could signal a continuation of the uptrend, with immediate resistance near the recent highs around 21,600.
A break below the trendline may shift attention to the 50-day SMA or the 20,800 level for potential support.
The US 100 Index remains within a broader bullish structure, with the rising trendline acting as a critical support level for near-term price action.
-MW

NASDAQ: Bullish until March 2025.Nasdaq is overbought on the 1D timeframe (RSI = 72.532, MACD = 396.420, ADX = 56.355) and is about to do the same on the 1W as well (RSI = 69.424). This is because the Bull Cycle is on full extent. However, in anticipation of Q1 2025, we are entering the final phase of the Cycle. This is a Top sequence that we've seen three time before in the last 10 years. The early signal for this is when the 3W RSI forms overbought (RSI > 70.000) LH. Each time that happened, the index had a sharp drop to at least the 3W MA50. TP = 19,000 could be an early target.
See how our prior idea has worked out:
## If you like our free content follow our profile to get more daily ideas. ##
## Comments and likes are greatly appreciated. ##

NASDAQ rally still has lots of upside before is tops.Nasdaq (NDX) is technically respecting the 2-year Channel Up that it's been trading in since the December 26 2022 market bottom. Its most recent Higher Low was on the August 05 2024 1W candle, which initiated the Bullish Leg we're currently in.
As you see, the previous two Bullish Legs had one main pull-back/ correction sequence each and apart from that, the majority of the Leg was technically a straight uptrend. Given that the current Bullish Leg already had a strong pull-back early on (August 26 - September 02 1W candles), it may continue to rise up to its target without another correction, assuming the 1D MA100 (red trend-line) holds.
If however it has another pull-back similar to the previous Bullish Leg (March 04 - April 15 2024), then it should rise some more near the 0.236 Fibonacci level and then pull-back.
In any event, the current level is technically a solid long-term buy entry and since both previous Bullish Legs have been around +48%, we expect to see 25300 before the current one tops.
-------------------------------------------------------------------------------
** Please LIKE 👍, FOLLOW ✅, SHARE 🙌 and COMMENT ✍ if you enjoy this idea! Also share your ideas and charts in the comments section below! This is best way to keep it relevant, support us, keep the content here free and allow the idea to reach as many people as possible. **
-------------------------------------------------------------------------------
💸💸💸💸💸💸
👇 👇 👇 👇 👇 👇

NVDA Finally Cracking?Trendline from October 2022 lows of around $10 USD has been intact so far and holding. However, we saw a close below the trendline last week which shows that the momentum is now waning and NASDAQ:NVDA might be getting ready for a trend change.

NASDAQ: Buy near the 4H MA50.Nasdaq is bullish on its 1D technical outlook (RSI = 62.360, MACD = 259.490, ADX = 43.763) as it remains within the medium term Channel Up. The recent bearish wave is correcting the uptrend towards the 4H MA50, which if technically holds, should give way to the new bullish wave. The 4H RSI is headed towards its S1 Zone, which is the buying level so you can time the entries acccordingly. Our target is the 2.0 Fibonacci extension (TP = 22,000).
See how our prior idea has worked out:
## If you like our free content follow our profile to get more daily ideas. ##
## Comments and likes are greatly appreciated. ##

NASDAQ consolidation until the CPI.Nasdaq (NDX) hit our 21650 Target that we set exactly 2 weeks ago (November 25, see chart below) and is now entering a consolidation phase (orange Rectangle):
As long as the 4H MA50 holds, the uptrend will stay intact within this 3-month Channel Up. We believe that this consolidation is similar to the September 13 - 19 price action, which also started after a +6.80% rise and with the support of the 4H MA50, it resumed the rally and peaked on the 1.5 Fibonacci extension.
As a result, we expect Nasdaq to stay ranged until Wednesday's U.S. CPI report and following that to resume the uptrend, targeting 22300 (just below the 1.5 Fib).
-------------------------------------------------------------------------------
** Please LIKE 👍, FOLLOW ✅, SHARE 🙌 and COMMENT ✍ if you enjoy this idea! Also share your ideas and charts in the comments section below! This is best way to keep it relevant, support us, keep the content here free and allow the idea to reach as many people as possible. **
-------------------------------------------------------------------------------
💸💸💸💸💸💸
👇 👇 👇 👇 👇 👇
