NASDAQ: Almost overbought but with no stop on this uptrend.Nasdaq is about to turn overbought on its 1D technical outlook (RSI = 68.420, MACD = 402.410, ADX = 22.800) but the current bullish wave shows no signs of stopping yet. The Channel Up since the April bottom indicates that a +9.50% rise is very likely before the next technical pullback, especially as long as the 1D MA50 is holding. Stay long, TP = 23,400.
## If you like our free content follow our profile to get more daily ideas. ##
## Comments and likes are greatly appreciated. ##
NASDAQ 100 CFD

10 Small-Cap Biotechs with Key Catalysts for 2025 July List________________________________________
🔬 10 Small-Cap Biotechs with Key Catalysts for 2025 July List
________________________________________
1. Allogene Therapeutics (NASDAQ: ALLO)
• Catalyst: Phase 2 data for ALLO-501A (anti-CD19 CAR-T for large B-cell lymphoma) expected in H2 2025; potential pivotal data could lead to regulatory submission.
• Highlights: “Off-the-shelf” allogeneic CAR-T approach could transform cell therapy; watch for manufacturing/scalability updates.
________________________________________
2. Lixte Biotechnology (NASDAQ: LIXT)
• Catalyst: Phase 2 combo trial of LB-100 (PP2A inhibitor) + immunotherapy in solid tumors, with key data expected in late 2025.
• Highlights: If efficacy signals emerge, could prompt partnerships or additional trials.
________________________________________
3. Iovance Biotherapeutics (NASDAQ: IOVA)
• Catalyst: Commercial launch and sales uptake for AMTAGVI (lifileucel, first FDA-approved TIL therapy in advanced melanoma); upcoming label expansion studies in lung and cervical cancer.
• Highlights: Investor focus on launch ramp, real-world data, and new trial initiations in 2025.
________________________________________
4. RenBio (NASDAQ: RENB)
• Catalyst: Phase 1/2 data for RB-100 (bispecific antibody platform in solid tumors) expected mid-to-late 2025.
• Highlights: Pipeline progress and partnership announcements possible.
________________________________________
5. IGM Biosciences (NASDAQ: IGMS)
• Catalyst: Phase 2 data for IGM-2323 (CD20 x CD3 bispecific in non-Hodgkin lymphoma) expected early 2025; ongoing updates from IgM antibody platform.
• Highlights: Investor interest in clinical safety, efficacy, and potential for big pharma tie-ups.
________________________________________
6. Zura Bio (NASDAQ: ZURA)
• Catalyst: Phase 2b/3 trial start and topline data for tibulizumab (IL-7Ra mAb for autoimmune diseases) expected late 2025.
• Highlights: Focus on rare and orphan autoimmune indications.
________________________________________
7. INmune Bio (NASDAQ: INMB)
• Catalyst: Phase 2 Alzheimer’s data (XPro1595, targeting neuroinflammation) and oncology pipeline updates expected H1 2025.
• Highlights: Any signal in Alzheimer’s is high-impact; monitoring for FDA guidance.
________________________________________
8. Veru Inc (NASDAQ: VERU)
• Catalyst: Phase 3 trial results for enobosarm (oral SARM) in advanced breast cancer expected 2025; also, COVID/sepsis drug updates.
• Highlights: Regulatory clarity and partnership/M&A rumors are potential drivers.
________________________________________
9. Century Therapeutics (NASDAQ: IPSC)
• Catalyst: First-in-human data for iPSC-derived NK and CAR-T cell therapies, with updates expected at major meetings in 2025.
• Highlights: Platform validation and early efficacy/safety signals.
________________________________________
10. ProKidney (NASDAQ: PROK)
• Catalyst: Phase 3 pivotal data for REACT (cell therapy for chronic kidney disease/diabetes) due late 2025.
• Highlights: If positive, could become the first autologous cell therapy for kidney disease.
________________________________________
🔎 How to Monitor These Catalysts
• FDA submissions/meetings (ALLO, PROK, VERU)
• Clinical trial readouts (LIXT, RENB, IGMS, ZURA, INMB, IPSC)
• Commercial/launch data (IOVA)
• Partnership/M&A activity (IGMS, VERU, RENB)
________________________________________
📊 Summary Table
Ticker Company Upcoming Catalyst/Event Timeframe
ALLO Allogene Therapeutics Phase 2 LBCL CAR-T pivotal data H2 2025
LIXT Lixte Biotechnology LB-100 + immunotherapy Phase 2 data Late 2025
IOVA Iovance Biotherapeutics AMTAGVI launch data; label expansions Throughout 2025
RENB RenBio Bispecifics Phase 1/2 data Mid-to-late 2025
IGMS IGM Biosciences IGM-2323 Phase 2 data (lymphoma) Early 2025
ZURA Zura Bio Tibulizumab Phase 2b/3 topline data Late 2025
INMB INmune Bio Alzheimer’s/oncology trial updates H1 2025
VERU Veru Inc Enobosarm Phase 3 (breast cancer) 2025
IPSC Century Therapeutics First-in-human iPSC cell therapy data 2025
PROK ProKidney REACT Phase 3 (CKD) pivotal readout Late 2025
________________________________________
⚠️ Word of Caution
Small-cap biotech stocks can be extremely volatile, especially around catalyst events (trial data, FDA decisions). Sharp price swings—both up and down—are common. Always conduct your own research and be aware of the risks.

DIYWallSt Trade Journal: Why Traders Are Rotating from Nasdaq to**07/01/25 Trade Journal, and ES_F Stock Market analysis **
EOD accountability report: +1160
Sleep: 5 hours
Overall health: Need to catch up on sleep again
** VX Algo System Signals from (9:30am to 2pm) 4/4 success**
9:39 AM Market Structure flipped bullish on VX Algo X3! :check:
11:00 AM Market Structure flipped bearish on VX Algo X3 :check:
11:24 AM VXAlgo ES X1 Buy signal :check:
12:00 PM Market Structure flipped bullish on VX Algo X3! :check:
**What’s are some news or takeaway from today? and What major news or event impacted the market today? **
RTY and YM leading the way today
NQ lagging
Why is this?
The answer is, Simple Supply and Demand theory.
Money has to come from somewhere.
If Money is going to YM and RTY,
Money has to leave from NQ or ES or both.
There is not an infinite amount of money, So if one index is outperforming like crazy over the other. It must be draining from it
Why would it drain from NQ? Easy
Because NQ and ES already hit ATH,
YM and RTY has not hit ATH yet.
So people are selling NQ and buying YM because it is on Discount
News
N/A
**What are the critical support levels to watch?**
--> Above 6235= Bullish, Under 6210= Bearish
Video Recaps -->https://www.tradingview.com/u/WallSt007/#published-charts

QQQ Nasdaq 100 Year-End Price Target and Technical Rebound SetupIf you haven`t bought the previous oversold area on QQQ:
Now the Nasdaq-100 ETF (QQQ), which tracks the performance of the largest non-financial companies in the Nasdaq, has recently entered oversold territory, suggesting that a technical rebound may be imminent. Similar to the Russell 2000, QQQ has experienced significant selling pressure, driving key technical indicators into oversold zones and creating favorable conditions for a bounce.
The Relative Strength Index (RSI) has dropped below 30, a level that typically signals oversold conditions and the potential for a reversal. Additionally, QQQ is trading near key support levels, with a large portion of its components underperforming their 50-day and 200-day moving averages — a classic setup for a mean reversion rally.
From a historical perspective, QQQ has shown a tendency to rebound strongly after similar oversold conditions, particularly when macroeconomic factors stabilize and buying pressure returns. Given the current technical setup, my price target for QQQ is $550 by the end of the year. This represents a recovery of approximately 8-10% from current levels, aligning with previous post-oversold rallies in the index.
While downside risks remain — including potential volatility around Federal Reserve policy and broader economic data — the technical backdrop suggests that QQQ is well-positioned for a recovery in the coming months.

NASDAQ Possible short-term pull-back.Last time we analyzed Nasdaq (NDX) was a week ago (June 23, see chart below), giving a comfortable buy signal as the price was rebounding at the bottom of the 6-week Channel Up:
The price hit our 22300 Target and has now touched the top of the Channel Up. Based on the 4H RSI, it resembles the May 15 price action, which soon after pulled back to the 0.382 Fibonacci retracement level.
It is possible to see such relief profit taking on the short-term and a test of 22200 (Fib 0.382).
-------------------------------------------------------------------------------
** Please LIKE 👍, FOLLOW ✅, SHARE 🙌 and COMMENT ✍ if you enjoy this idea! Also share your ideas and charts in the comments section below! This is best way to keep it relevant, support us, keep the content here free and allow the idea to reach as many people as possible. **
-------------------------------------------------------------------------------
Disclosure: I am part of Trade Nation's Influencer program and receive a monthly fee for using their TradingView charts in my analysis.
💸💸💸💸💸💸
👇 👇 👇 👇 👇 👇

US100 (NASDAQ) BREAKOUT BLUEPRINT: LOOT LIKE A SMART TRADER!🔥 NASDAQ 100 HEIST: STEAL THE TREND LIKE A MARKET BANDIT! 🚨💰
Locked & loaded for the US100 (NASDAQ 100) heist? This slick blueprint cracks the code to loot profits—blending killer technicals with macro intel. Ride the bullish wave, but dodge traps near the Overbought Zone. Bears lurk, so secure your bag before the reversal hits! 🐻💨
🎯 ENTRY: STRIKE LIKE A PRO THIEF
Long the breakout near 21,500.0 (or ambush pullbacks at 20,400.0 & 19600.0).
Set stealth alerts to catch moves in real-time. 🕶️🔔
🛡️ STOP LOSS: ESCAPE ALIVE
Hide stops under the last 4H swing low/wick—no reckless bets!
Adjust for your risk—survivors play smart. ⚡
💸 TAKE PROFIT: VANISH WITH THE LOOT
Main Target: 22,250.0 (or bail early if momentum fades).
Scalpers: Trail stops & ghost out with quick wins. 🏃♂️💨
📡 WHY THIS HEIST WORKS
NASDAQ 100’s on fire: Fundamentals + COT data + macro tides align.
Sentiment’s bullish, but stay sharp—links below for the full intel. 🔍🌐
⚠️ WARNING: NEWS = POLICE SIRENS
Avoid new trades during high-impact news. 📢
Lock profits with trailing stops if you’re already in. 🔐
🤝 JOIN THE TRADING MAFIA
Smash LIKE, drop a comment, & let’s dominate the US100! �
Ready for the next big move? Stay tuned. 👀
Happy hunting, chart pirates! 🏴☠️📉

Smart Friday Trades: NASDAQ Setup and Key Levels to Watch NAS100📊 NASDAQ US100 Analysis – Friday Setup
I'm currently watching the NASDAQ closely 👀. The NAS100 looks significantly overextended 📈, and with it being the end of the week, we often see price action push into the weekly high before pulling back into the weekly close 🔁.
This is a pattern I’ve seen play out many times during the New York session on Fridays 🗽📉.
💡 Here’s my suggestion:
Wait for today’s data release 📅 to finish. If price ranges and then breaks market structure to the downside, keep an eye out for a short entry on the retrace and retest of the range low.
🎯 Your targets and stop loss are outlined clearly in the video, so make sure to watch it through.
⚠️ Trade sensibly, manage your risk, and don't rush into anything.
I'd love to hear your thoughts in the comments 💬
Have an awesome day and I’ll see you in the next one! 🚀

Nvidia & Nasdaq History - What you need to know!Record-high share price: NVDA hit a new all-time high as U.S. stock markets rallied and Wall Street analysts forecast continued upside
Nvidia is pushing towards the first ever $4 Trillion market cap.
Today it surpassed MSFT as the largest company in the world closing up over 4% on the session.
Micron earnings are adding extra fuel to the fire for semi conductors.
Short term picture for semis - they're very extended and need some consolidation.
Micron earnings: Revenue: $8.05 billion, up ~38% YoY, beating the ~$7.89 billion consensus
Data‑center revenue: Tripled YoY, powered by surging demand for high‑bandwidth memory (HBM)
HBM sales: Exceeded $1 billion, growing over 50% sequentially
Strong margin and revenue beat; robust cash flow (~$857 million free cash flow) with a solid balance sheet ($9.6 billion in liquidity)

NASDAQ: Short-lived pullback ahead of major breakout.Nasdaq has entered strong bullish territory on its 1D technical outlook (RSI = 66.290, MACD = 331.080, ADX = 18.600). Despite that, it remains inside a slow moving Channel Up for the past month in contrast to the more aggressive bullish waves of the Channel Up in April and May. The 4H RSI peak may be similar to May 12th and April 24th. We believe that at least a +9.69% rally will emerge to approach the top of this 3 month Channel Up. Stay bullish, TP = 23,400.
## If you like our free content follow our profile to get more daily ideas. ##
## Comments and likes are greatly appreciated. ##

Nasdaq All-Time Highs, S&P Close, Blast Off or Breakdown?What an incredible melt-up since April 7 lows in the US markets.
Trump vs Musk - ignored
Iran vs Israel - ignored
High Valuations - ignored
FED Pausing - ignored
The US economy is resilient and it's a good thing because the world is performing really well (EX-US). Europe/China/India/Emerging Markets are outperforming the US by 15-16% YTD
The USD is having one its worst years ever in 2025
Gold, Silver, Bitcoin are great diversifiers in my opinion for 2025
Oil prices are incredibly volatile and energy stocks and commodities in turn are showing
volatility and big swings
As we near end of month and end of Q2, I have to believe the market is due for a small pause or pullback sooner rather than later - but we'll see
Thanks for watching!!!

MAOR HEAD N SHOULDER TOP FORMATION I AM 100 % SHORT NOW The chart posted is that on the NDX 100 .This is my view of what has formed . best of trades WAVETIMER

Can Geopolitics Power Tech's Ascent?The Nasdaq index recently experienced a significant surge, driven largely by an unexpected de-escalation of tensions between Israel and Iran. Following a weekend where U.S. forces reportedly attacked Iranian nuclear sites, investors braced for a volatile Monday. However, Iran's measured response - a missile strike on a U.S. base in Qatar, notably without casualties or significant damage - signaled a clear intent to avoid wider conflict. This pivotal moment culminated in President Trump's announcement of a "Complete and Total CEASEFIRE" on Truth Social, which immediately sent U.S. stock futures, including the Nasdaq, soaring. This rapid shift from geopolitical brinkmanship to a declared truce fundamentally altered risk perceptions, alleviating immediate concerns that had weighed on global markets.
This geopolitical calm proved particularly beneficial for the Nasdaq, an index heavily weighted towards technology and growth stocks. These companies, often characterized by global supply chains and reliance on stable international markets, thrive in environments of reduced uncertainty. Unlike sectors tied to commodity prices, tech firms derive their value from innovation, data, and software assets, which are less susceptible to direct geopolitical disruptions when tensions ease. The perceived de-escalation of conflict not only boosted investor confidence in these growth-oriented companies but also potentially reduced pressure on the Federal Reserve regarding future monetary policy, a factor that profoundly impacts the borrowing costs and valuations of high-growth technology firms.
Beyond the immediate geopolitical relief, other crucial factors are shaping the market's trajectory. Federal Reserve Chair Jerome Powell's upcoming testimony before the House Financial Services Committee, where he will discuss monetary policy, remains a key focus. Investors are closely scrutinizing his remarks for any indications regarding future interest rate adjustments, particularly given current expectations for potential rate cuts in 2025. Additionally, significant corporate earnings reports from major companies like Carnival Corporation (CCL), FedEx (FDX), and BlackBerry (BB) are due. These reports will offer vital insights into various sectors' health, providing a more granular understanding of consumer spending, global logistics, and software security, thereby influencing overall market sentiment and the Nasdaq's continued performance.

Market Structure Breakdown on NASDAQ: What Traders Should Watch📉 NASDAQ (NAS100, US100) Analysis 🧠💼
I’m currently keeping a close eye on the NASDAQ (NAS100) — price action is telling a story worth watching.
📆 Last week, the index came under clear pressure, and now on the 4H timeframe, we’re seeing a defined bearish structure with consistent lower highs and lower lows 📉🔻. This recent expansion to the downside has led to a break in market structure (BOS), and price is now pulling back into equilibrium 🔄.
⏳ For now, it’s a waiting game. I’m watching to see if this pullback finds resistance at a premium level and rotates back to the downside, which would present a potential short setup 🎯📊.
🕒 On the 30-minute chart, I’m monitoring for a clear structural shift — a change in momentum that confirms bearish intent. Should the NASDAQ resume its downward move, it could trigger risk-off sentiment, bringing strength into the JPY pairs 💴🚨 as capital flows out of risk assets.
⚠️ Disclaimer:
This analysis is for educational purposes only and should not be considered financial advice. Always conduct your own research and consult with a licensed financial advisor before making any trading decisions. 📚💼

NASDAQ Will the 4H MA200 support the Channel Up?Nasdaq (NDX) has been trading within a Channel Up since mid-May and today almost touched the pattern's bottom, making a Higher Low. At the same time, the 4H MA200 (orange trend-line) is right below it, the medium-term's natural Support.
Since the 4H RSI also bounced on the 32.20 Support, which is where the pattern bottomed on May 23, we expect the new Bullish Leg to start, as long as of course the 4H MA200 holds. The Target is the 1.382 Fibonacci extension at 22300.
-------------------------------------------------------------------------------
** Please LIKE 👍, FOLLOW ✅, SHARE 🙌 and COMMENT ✍ if you enjoy this idea! Also share your ideas and charts in the comments section below! This is best way to keep it relevant, support us, keep the content here free and allow the idea to reach as many people as possible. **
-------------------------------------------------------------------------------
Disclosure: I am part of Trade Nation's Influencer program and receive a monthly fee for using their TradingView charts in my analysis.
💸💸💸💸💸💸
👇 👇 👇 👇 👇 👇

NASDAQ Long-term looks brighter than ever!Nasdaq (NDX) has been trading within a massive Channel Up since the bottom of the 2008 U.S. Housing Crisis and during the April 07 2025 bottom, a very distinct bullish signal emerged.
The index hit its 3W MA50 (blue trend-line) for the first time since May 2023. As you can see, since the 2008 Crisis, every time the market rebounded after hitting the 3W MA50, it posted a rise of at least +62.06% before the next time it touched it (and that was on the highly irregular COVID crash).
As a result, we expect to see NDX hit at least 26500 (+62.06%) before a new 3W MA50 test. Chances are we see the market move much higher though.
Note also the incredible bounce it made on the 3W RSI 14-year Support Zone.
-------------------------------------------------------------------------------
** Please LIKE 👍, FOLLOW ✅, SHARE 🙌 and COMMENT ✍ if you enjoy this idea! Also share your ideas and charts in the comments section below! This is best way to keep it relevant, support us, keep the content here free and allow the idea to reach as many people as possible. **
-------------------------------------------------------------------------------
💸💸💸💸💸💸
👇 👇 👇 👇 👇 👇

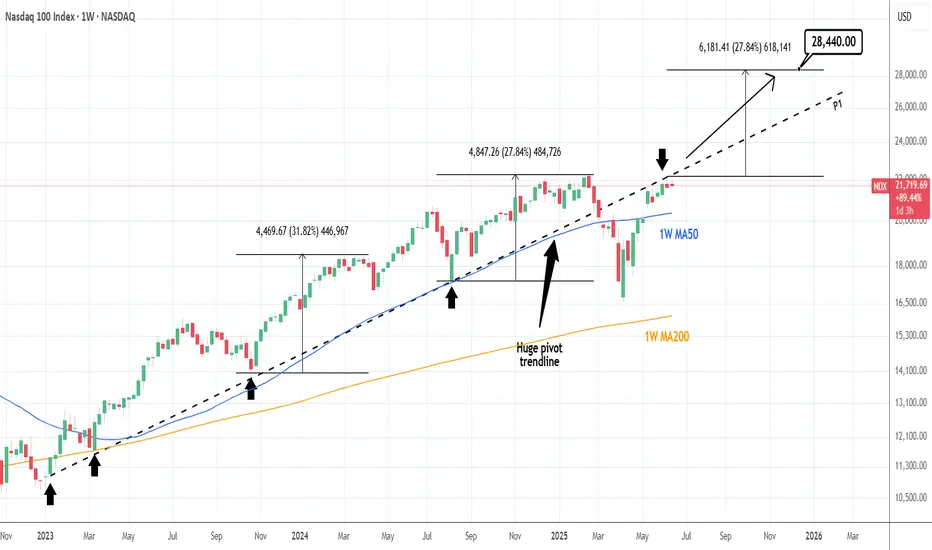
NASDAQ: Huge pivot can catapult it if broken.Nasdaq has turned neutral again on its 1D technical outlook (RSI = 54.712, MACD = 377..560, ADX = 20.644) as it has been struggling to cross above a hidden trendline, the Pivot P1 that was at the start of this Bull Cycle a support and after the trade war acts now as a resistance. If broken, we anticipate a +27.84% rise at least (TP = 28,440), which may very well be an end of year target.
## If you like our free content follow our profile to get more daily ideas. ##
## Comments and likes are greatly appreciated. ##
QQQ - NASDAQ Has Never Been This ExpensiveQQQ relative to the money supply reveals that markets have never been this expensive in history. Despite the significant amount of money pumped in during the COVID-19 pandemic, the economy has not kept pace with all the zeros added to Gov debt.
If we can't lower deficits now at max employment, when will we?
Tulips!
Caution is in order despite what "experts" may tell you.
Click like Follow Subscribe, let's get to 5,000 followers.

NASDAQ 100 Bullish Breakout Potential: What to Watch NextI'm currently monitoring the NASDAQ 100 (NAS100) very closely. Building on yesterday’s outlook, we've now seen a clear bullish structural shift — price is holding firm above a recent higher high and higher low, suggesting the early stages of a potential trend continuation 📈
Zooming into the 30-minute chart, we can track price action more precisely. I’m watching for a decisive break above the current range high on this timeframe. If we get the break → retest → rejection pattern, this would confirm bullish momentum and provide a long opportunity 🚀
Should this scenario play out, we could also see JPY pairs strengthen to the upside, as a risk-on sentiment flows through the markets 🧭
🔍 This setup is developing — as always, patience and precision are key.

NASDAQ Close to the 1st 1D Golden Cross in 2 years!Nasdaq (NDX) has been trading within a Channel Up since the December 2022 Low and is currently extending the gains of the latest Bullish Leg.
At the same time it is about to form the first 1D Golden Cross in more than 2 years (since March 08 2023). The last two major Bullish Legs of this pattern, before the previous one was interrupted by the Trade War, were pretty symmetrical, peaking at +49.21% and +47.47% respectively.
If the current one follows the +47.47% 'minimum', we should be expecting Nasdaq to hit 24000 by late Q3.
-------------------------------------------------------------------------------
** Please LIKE 👍, FOLLOW ✅, SHARE 🙌 and COMMENT ✍ if you enjoy this idea! Also share your ideas and charts in the comments section below! This is best way to keep it relevant, support us, keep the content here free and allow the idea to reach as many people as possible. **
-------------------------------------------------------------------------------
Disclosure: I am part of Trade Nation's Influencer program and receive a monthly fee for using their TradingView charts in my analysis.
💸💸💸💸💸💸
👇 👇 👇 👇 👇 👇

push up nasdaqwe can see that the market has properly push to the upside, looking for a break of range.
entry is in blue, and correspoinds to daily levels that has shown rejection to the upside.
possible drop in the first minutes, and then a move to the upside.
entry in blue. stop in red and target in green.
HAVE FUN
TSP

NDX CRACK!I will keep this simple.
The rising wedge broke. Markets are in trouble.
The Trump disaster keeps escalating every day.
This is what the world looks like without the US
strong leadership defending freedom and democracy. CHAOS!

Volatility Incoming - But Price Will Say WhenKey levels on SPX and NDX
5905 big gamma level and hedging level for June 30 monthly and quarter expiration
DXY watching for potential bear trap and range trade
Gold, Silver, Bitcoin and others all discussed
Thanks for watching!!!

NDX its a short for like month?this is only an Idea !
due to many fvg's and gaps this is more likely to happen
you can see the long 30d / 40d target on chart
