♨ Nvidia stocks are heading Up to recover, after September meltNvidia stocks moved higher in early Monday trading after analysts at Goldman Sachs NYSE:GS added the chipmaker, along with three other stocks, to its flagship list of stock recommendations.
Goldman Sachs analysts added Nvidia to the bank's "Americas Conviction List", a step up from the 'buy' rating it assigned to the stock in late August, while holding its price target in place at $605 per share.
"Look for Nvidia to maintain its statues as the accelerated computing industry standard for the foreseeable futures given its competitive moat and the urgency with which customers are developing and deploying increasingly complex AI models," Goldman argued.
The bank also added cybersecurity group Okta NASDAQ:OKTA , industrial supply group Cintas NASDAQ:CTAS and biotech Quanterix NASDAQ:QTRX to the "conviction buy" list while removing Salesforce NYSE:CRM and Johnson Controls NYSE:JCI .
Nvidia, the world's biggest AI chipmaker, forecast current quarter revenues of around $16 billion in August when it published stronger-than-expected second quarter earnings and later unveiled an make it easier for clients to run AI applications on Google Cloud NASDAQ:GOOGL using Nvidia-made chips with deeper integration between hardware and software offerings.
"We’re at an inflection point where accelerated computing and generative AI have come together to speed innovation at an unprecedented pace," said CEO Jensen Huang of the Google agreement. "Our expanded collaboration with Google Cloud will help developers accelerate their work with infrastructure, software and services that supercharge energy efficiency and reduce costs."
Nvidia shares were marked 3% higher in early Monday trading to change hands at $ 448 /share. The stock is up more than 200% for this year, and reached an all-time high of $487.84 on Aug 29, 2023.
Technical picture says, Nvidia NASDAQ:NVDA stocks are still on its positive path, and trading above 6- and 12-months simple moving averages.
Moreover the key breakout of technical indicator known as "a Triangle" is happening right here as stocks are recovering form the bearish hug.
NASDAQ 100 CFD

NAS sitting on the fenceWith NVIDIA earnings due, NAS seems to be sitting on the fence in terms of direction, so I am considering all options
Feel free to comment what your thinking or what i've missed

NVDA Feb 19th UpdateThis is my pathway down after the primary target hit in Mar.
5EMA is the must break for this pathway or it will push into the Main Target box first.
The price is in supper extended territory. We should see Maj support box tested at some point in time this year.

Members Daily Analysis Feb 15Small Caps strong on weak dollar and yields.
QQQ & XLK lagging on Microsoft weakness
Semiconductor & Cloud stocks showing weakness.
Oil strong + Nat Gas weak

Last Buy trade for me on Nasdaq.I will target 18000 for this trade and may enter a short trade afterwards. Will wait and see confirmation on 15M chart

Occidental Petroleum Corp.: Bullish Bias. ContinuationTo be successful on Wall Street, it is important to be flexible and be able to recognize changing market winds - the patterns that tell investors when to get in and out of the market.
Sometimes a breeze is a warm and inviting wind: assets rise in value, and it seems that everyone is making money.
Other times, it turns into a violent storm, leaving in its wake financial destruction, memories of the past, and hope that better times are yet to come.
Occidental Petroleum Corporation (often abbreviated as Oxy in reference to the symbol and logo) is an American company engaged in hydrocarbon exploration in the United States and the Middle East, as well as petrochemical production in the United States, Canada and Chile.
The oil company, among other Value Investing Assets, has become one of the main beneficiaries of the weakening and reversal of WFH ("Working From Home") disinflationary trends that quickly shook the entire financial world against the backdrop of the Covid-19 pandemic in Q1 2020. But faded also just as quickly, while since the first quarter of 2021, in two years, many growth assets have been undermined, rocked by scandals, or completely destroyed.
It was revealed in March that Warren Buffett's Berkshire Hathaway added more shares to an already large bet on Occidental Petroleum, according to an SEC Form 4 report released on March 7, 2023.
The Buffett conglomerate bought nearly 5.8 million shares of the oil company over multiple trading sessions in March, at prices ranging from $59.85 to $61.90, according to the documents.
Berkshire now owns 200.2 million shares of Occidental, totaling 22.2% of the oil company's shares, up from 21.4% previously.
Occidental shares are currently among the top 10 Berkshire holdings. The energy company outperformed the S&P 500 index last year, more than doubling in price.
In March, Occidental CEO Vicki Hollub said in an interview with CNBC that she met with the 92-year-old investor, noting that they talked about the oil and gas industry and related technologies.
Last August, Berkshire received regulatory approval to buy up to 50% of Occidental, sparking speculation that Berkshire could eventually buy out the entire Occidental company.
Berkshire also owns $10 billion of preferred shares in Occidental and has warrants to buy another 83.9 million shares of common stock for $5 billion, or $59.62 each. The warrants were obtained as part of the company's 2019 deal that helped finance the purchase of Anadarko Occidental.
While many investors even now continue to believe in the crypto-snow that melted without a trace the winter before last, the technical picture indicates the possibility of Growth comtinuation in value investment assets, incl. Occidental Petroleum - after the completion of the 0.618x Fibonacci retrace to the Growth that began later to Russian President "Special Military Operation" announcement in Q1'22.
Also, the support of weekly SMA (200) in CL1! - Crude Oil Futures adds bullish bias to market participants.

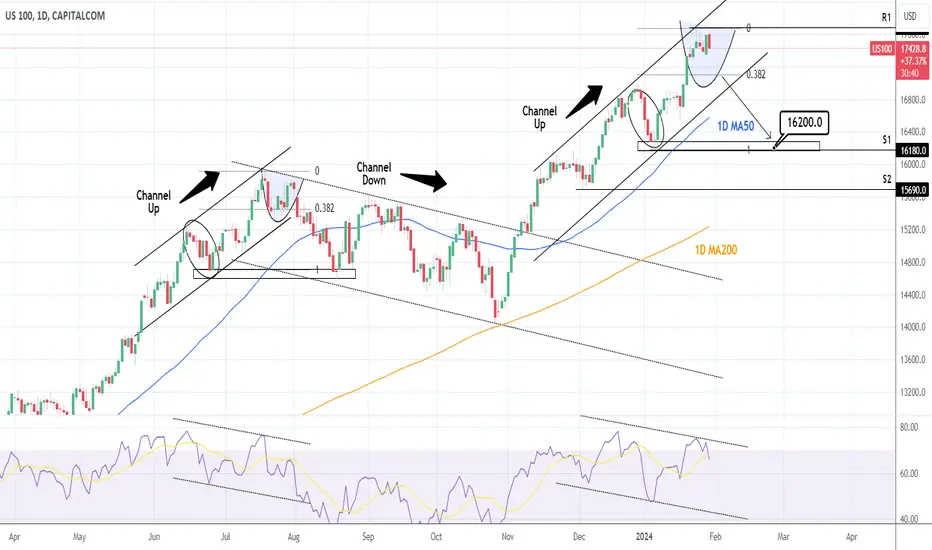
NASDAQ: Short term sell initiatedNasdaq is approaching technical neutrality on the 1D timeframe (RSI = 57.511, MACD = 191.510, ADX = 25.356) as it got rejected near the top of a Double Channel Up pattern. The 1D RSI is printing a technical sequence resembling the July 31st 2023 LH, which was the start of a short term correction. Along those lines, we are opening a short, aimed at the 1D MA100 (TP = 16,850).
## If you like our free content follow our profile to get more daily ideas. ##
## Comments and likes are greatly appreciated. ##

NASDAQ Can this selling be sustainable?Last week (February 08, see chart below), we gave a sell signal on Nasdaq (NDX) as the the price wasn't just at the top of the short-term (dashed) Channel Up, but was also approaching the top (Higher Highs trend-line) of the 1-year Channel Up:
As the index suffered strong intra-day selling yesterday, following the higher than expected U.S. CPI report (investors initially view this as an excuse for the Fed not to cut rates quickly), it is a good time to update our outlook. In this effort, we will look at it through the shorter term 4H time-frame this time.
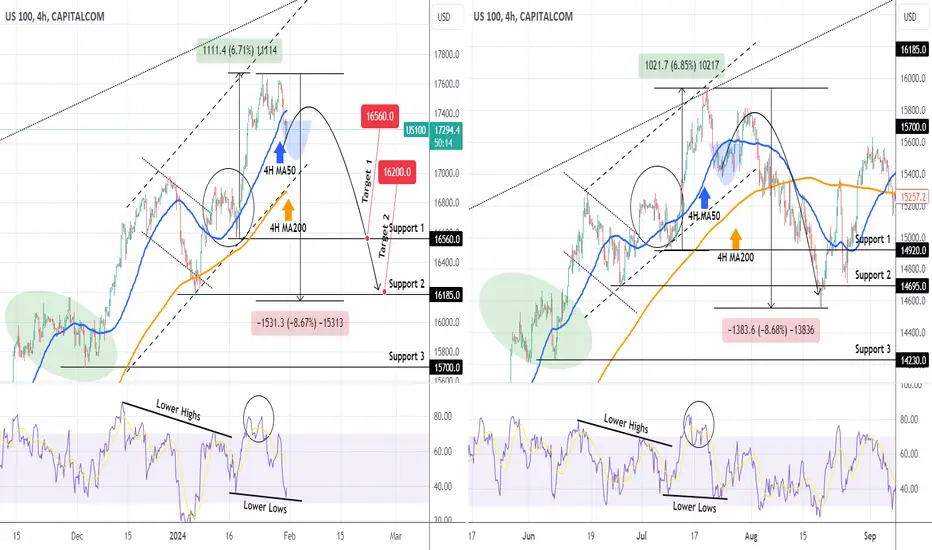
As you can see, the price breached yesterday not only the 4H MA50 (blue trend-line) but also the 4H MA100 (green trend-line), which was the first time (for the latter) since January 17, so almost 1 month. This is the first significant bearish signal for the medium-term but the confirmation will come only if a 1D candle closes below it. In that case, we expect the decline to reach first the 4H MA200 (orange trend-line) - 1D MA50 (red trend-line) Support cluster and then after a rebound gets confirmation with a rejection on the 4H MA50 (blue trend-line), target 16550, which is Support 2 and a potential 1D MA100 (yellow trend-line) contact. In that scenario, look also for the 1D RSI breaking below its Support Zone.
On the other hand, since the index is rebounding today and is already on the 4H MA50, we will wait for the daily candle closing. If it is above it (as in the cases of the February 01 and January 09 break-outs), it will most likely suggest that the bullish trend is intact. In that case, we will buy the break-out and target 18400, just below the 1.786 Fibonacci extension, which was the Target of both previous Higher Highs.
-------------------------------------------------------------------------------
** Please LIKE 👍, FOLLOW ✅, SHARE 🙌 and COMMENT ✍ if you enjoy this idea! Also share your ideas and charts in the comments section below! This is best way to keep it relevant, support us, keep the content here free and allow the idea to reach as many people as possible. **
-------------------------------------------------------------------------------
💸💸💸💸💸💸
👇 👇 👇 👇 👇 👇

GOLD dump fractal 2024/2023/2022 TP 1800 USD🔸Hello guys , today let's review daily price chart for gold. All previous setups
that I've posted already hit TP, congrats if you followed.
🔸DUMP fractal in progress, it's the same distribution/dump fractal that
resulted in heavy corrections in 2022/2023. On the left we got the current
price fractal, on the right past dump fractals from 2022/2023.
🔸Based on previous corrections, we can expect 10-18% correction in gold
prices from the top (topped out near 2075 usd). Expecting more weakness
over next months, until we complete the dump sequence.
🔸Conservative target is 1800 USD, which is a 12% correction off the highs.
Aggressive target is 1700 USD, which will require a more steep correction in
gold prices. However, I'm expecting prices to stall / reverse near 1800 USD.
🎁Please hit the like button and
🎁Leave a comment to support our team!
RISK DISCLAIMER:
Trading Futures , Forex, CFDs and Stocks involves a risk of loss.
Please consider carefully if such trading is appropriate for you.
Past performance is not indicative of future results.
Always limit your leverage and use tight stop loss.

UK100 8 hours short rips/rallies tp 7350🔸Hello traders, this is 8hour chart of UK100. Recently trading in well-defined
trading range, risk/reward flipped in bears favor after we got rejection near
range highs, therefore recommend to focus on sell setups.
🔸Range highs set at 7660, range lows set at 7350, premium prices overhead
at 7700 and 7750, below at 7250 and 7300. Trading now near range highs.
🔸Recommended strategy bears: focus on short selling rips/rallies, bears
will target re-test of range lows near/at 7350. strong risk/reward on sell side.
🎁Please hit the like button and
🎁Leave a comment to support our team!
RISK DISCLAIMER:
Trading Futures , Forex, CFDs and Stocks involves a risk of loss.
Please consider carefully if such trading is appropriate for you.
Past performance is not indicative of future results.
Always limit your leverage and use tight stop loss.

2-13 NQ Recap2/12 Weekly Plan. NQ Futures March ESH24 Weekly Pivot is 18,007
Targets
18,112
18,270
18,426
Targets
17,864
17,660
17,482

Nasdaq - Time To SellHello Traders, welcome to today's analysis of Nasdaq.
--------
Explanation of my video analysis:
For more than 14 years the nasdaq has been trading in a super obvious bullish parallel rising channel. In the beginning of 2023 we had another retest of the lower support which was followed by a +65% rally. If the Nasdaq rejects the current resistance towards the donwside and retests the support mentioned in the analysis, I will then be looking for long setups again.
--------
I will only take a trade if all the rules of my strategy are satisfied.
Let me know in the comment section below if you have any questions.
Keep your long term vision.

2/12 Weekly Plan. NQ Futures March ESH24 Weekly Pivot is 18,0072/12 Weekly Plan. NQ Futures March ESH24 Weekly Pivot is 18,007
Targets
18,112
18,270
18,426
Targets
17,864
17,660
17,482
Now trading at 18,030
Alerts
You will receive alerts in this channel every time NQ hits (2M candle close):
Weekly opening TBD
Weekly pivot at 18,007
Each weekly target.
Side notes
NQ is currently OTFU in (D-W-M), daily timeframe.

Nasdaq (us100)
Hello
Let's have a new update of Nasdaq
Well, we see that we are strongly bullish. Be careful, friends, do not enter into sales transactions
Only sell as a quick scalp
With this bullish intensity, targets of 19,000 and 20,000 will be available
Do not enter into any transaction without confirmation

Possible Significant RecoveyThis scenario is VERY tricky, let me explain why it could go either way, drastically. I'll separate the bull/bear ideas. The nasdaq looks like it could bounce off the BB bottom for a decent recovery, but, it's to see what happens tomorrow.
Reasons for Bull Rally
This month inflation report is cooler.
With a lower CPI, markets will anticipate a 50 basis point or 25 basis point hike, meaning a more dovish stance from the Fed.
Reasons for Selling
This month inflation report is still high or hotter than expected.
With a higher CPI, markets will anticipate a 75 basis point or higher hike, meaning a more hawkish stance from the Fed.
July 29th Q2 GDP comes in negative, officially putting the US in recession.
The negativity possibility is significant. July economic data can break markets like not seen before. This is one to watch. I understand this is the 1M chart, so any move upward will be quick. I don't see markets rising for a few months, but, who knows.

Biden Economic Failure, You Are Now in a Recession [SPX 1599]Hello everyone, I am back with another chart, this is the top for SPX. We are now in a recession.

NASDAQ is very close to the top of the 1-year Channel Up! Sell?Nasdaq (NDX) is extending its aggressive rise of the Bullish Leg that started on the October 26 2023 Higher Low of the 1-year Channel Up and by the strength of it, it appears it will extend it to the max. That potential max extension is in the range of 18100 - 18300, which is the top of the dashed Channel Up and the top of the dotted 1-year Channel Up, which was initiated on the market Low of January 06 2023.
A news/ fundamentals based approach could time the bearish reversal after next Tuesday's U.S. CPI report. Technically though, the 1D RSI being on Lower Highs ever since December 19 2023, shows that technically we are already on a strong Bearish Divergence that can reverse any moment. The similarities with the previous Channel Up Higher High on July 18 2023 are striking, with the only exception that the current dashed Channel Up is overextending the 2nd peak.
Regardless of that, the 1D RSI is coming out a similar Megaphone and appears to be on a similar Lower High as July 31 2023. A similar RSI pull-back can be seen from February 02 to March 10 2023, which resulted into a -9.35% decline for Nasdaq. The August 18 2023 decline was translated into a -8.55% decline. As a result, assuming that 18100 is a potential peak for the index, we are targeting a minimum -8.55% decline, which falls directly on Support 2 at 16550. That would break the 1D MA50 (blue trend-line) and make contact with the 1D MA100 (green trend-line).
-------------------------------------------------------------------------------
** Please LIKE 👍, FOLLOW ✅, SHARE 🙌 and COMMENT ✍ if you enjoy this idea! Also share your ideas and charts in the comments section below! This is best way to keep it relevant, support us, keep the content here free and allow the idea to reach as many people as possible. **
-------------------------------------------------------------------------------
💸💸💸💸💸💸
👇 👇 👇 👇 👇 👇

NAS100 - EMBARKING ON THE BIGGEST BULLRUN IN HISTORY? Hello Traders, what a week it has been! So I think it is justified to provide you with everything I know and show you how I see things. On the chart you’ll notice an image. The image shows theoretical price action with a parabolic curve step-like formation, representing an idealised pattern in price action trading. The formation begins with Base 1, where the stock starts to show an uptrend, followed by Base 2, indicating continued growth and increased investor interest. Base 3, marked by an "X", signals a critical entry point for traders, as it suggests potential for the stock to double in value rapidly. We are depicted to be at this third phase, which is considered the most opportune moment for entry before the final ascent. Base 4 represents the peak of the trend, culminating in a Sell Point where the stock reaches its maximum and sharply declines, thus completing the pattern.
However, as we gear up for the CPI data release on the 13th of February, be aware that it might steer us into a broad consolidation phase. The market's parabolic trend may not be sustainable given the upcoming figures. Prudence is key here—anticipate potential stabilisation or sideways price action as the market digests the CPI results.
Additionally, watch out for how price reacts to the BOS level. No structure is definite and it's important to adapt to what price is showing us and not to cling to an idea that no longer is valid.
NAS100 Weekly
NAS100 Daily
To add to this NAS100 analysis, I think it’s important to discuss its main components. The "Magnificent Seven" Big Tech stocks, including Nvidia, Apple, and Amazon, have seen varied performance since the pandemic, challenging the notion of them as a homogenous group. The dispersion in their returns and diverse business models highlight the differences within the sector. While Nvidia thrives as an AI specialist and Apple boasts defensive qualities, Amazon combines retail with cloud computing. The sector's valuation spectrum reflects a mix of growth prospects and market expectations, suggesting a nuanced investment landscape rather than a uniform "bubble." This diversity raises questions about the future performance of growth versus value stocks within these leading tech companies.
Apple's revenue grew during the holiday quarter, driven by iPhone sales and a record in services, despite a drop in China sales due to competition and geopolitical issues. The company faces regulatory scrutiny and a patent dispute, but remains optimistic about its product ecosystem and upcoming launches like the Vision Pro headset.
Amazon's stock surged 7.9% following a report of strong holiday sales, boosting its market value by approximately $135bn. CEO Andy Jassy highlighted the company's future focus on AI, projecting AI revenues to reach "tens of billions," further driving optimism for its growth potential.
Alphabet's shares dropped after advertising revenues missed expectations, despite integrating its Gemini AI into various services. The company plans significant investments in AI infrastructure, raising investor concerns about the balance between growth and expenditure in the generative AI race.
Meta's shares soared over 20% after announcing a first-ever dividend and a $50bn increase in share buybacks, signalling recovery from a recent advertising slump. The company plans more investment in AI and the metaverse, despite expecting short-term AI products not to significantly drive 2024 revenue. Full-year expenses are projected to rise notably.
Nvidia's dominance in the AI chip market, essential for technologies like OpenAi's ChatGPT, has driven its significant growth, with the stock more than doubling in value over the past year. This surge contrasts with the broader semiconductor industry's struggles with excess inventory and reduced demand in other sectors. Nvidia's success is partly due to partnerships with major tech firms like Microsoft and Meta, with the latter planning to acquire almost 600,000 high-end Nvidia GPUs for AI research. This focused investment in AI has positioned Nvidia at the forefront of the data centre market, overshadowing traditional leaders like Intel.
Microsoft's shares fluctuate after announcing strong cloud sales integrated with OpenAI's tech, but ended lower due to concerns over high investments in AI infrastructure. Despite a 20% increase in cloud revenues, investors remain cautious about the costs associated with expanding AI capabilities.
Tesla's shares dropped 12% amid warnings of lower sales growth due to reduced demand and increased competition. CEO Elon Musk announced a new lower-cost car for 2025, aiming to regain momentum. Tesla faces challenges from price cuts, higher costs, and a shift in the EV market, impacting its financial performance.
Here’s some economic theory for you, to add some more depth to the analysis. The Federal Reserve's monetary policy, particularly changes in the federal funds rate, has a significant impact on bond yields and, subsequently, stock prices. When the Fed raises interest rates to combat inflation or cool down an overheating economy, bond yields tend to rise as well. Higher bond yields make bonds more attractive relative to stocks, which can lead to a decline in stock prices as investors may shift away from equities. Conversely, when the Fed lowers interest rates to stimulate economic growth, bond yields often decrease, making stocks more appealing, which can boost stock prices. So, Fed rate decisions play a crucial role in influencing the relationship between bond yields and stock prices. In economic theory, bond yields and stock prices exhibit a negative correlation. This is why yield charts matter. Have a look:
The general outlook is that the US Federal Reserve is cautious about cutting rates despite inflation slowing, due to concerns about potential economic growth and inflation resurgence. Market expectations of rate cuts exceed the Fed's projections, but with inflation drivers easing, the case for reducing rates is growing stronger. However, the US job market added 353,000 jobs in January, surpassing the expected 180,000, leading to reduced expectations for a Federal Reserve interest rate cut in March. The strong job growth supports the Fed's cautious stance on rate cuts, despite political pressures. In my opinion, if the US economy continues to show such resilience and the next CPI release is lower than consensus, we might be witnessing the beginning of the largest bull run in history.
In summary, the NAS100's trajectory is at a crossroads with the upcoming CPI data potentially triggering market consolidation, despite the recent parabolic pattern. The diverse performance among Big Tech stocks underscores the need for nuanced analysis. While Federal Reserve policies continue to sway bond yields and stock prices, the strong job market suggests caution in anticipating rate cuts. Keep a close eye on how the NAS100 responds to the interplay of inflation data and tech sector dynamics. Overall, maintain a strategic approach and be ready to adjust to new information as we navigate these complex market conditions. Stay informed, stay agile.
As always, I hope you enjoyed this one and have a great weekend!! ;)

NDX Will Fall! Short!
Here is our detailed technical review for NDX.
Time Frame: 3h
Current Trend: Bearish
Sentiment: Overbought (based on 7-period RSI)
Forecast: Bearish
The market is approaching a key horizontal level 17459.6.
Considering the today's price action, probabilities will be high to see a movement to 17253.0.
P.S
We determine oversold/overbought condition with RSI indicator.
When it drops below 30 - the market is considered to be oversold.
When it bounces above 70 - the market is considered to be overbought.
Like and subscribe and comment my ideas if you enjoy them!

NDX / 4H / TECHNICAL ANALYSIS NASDAQ:NDX The support level at 16019 indicates the formation of a bearish wedge pattern and an AB=CD pattern. I have identified my targets on the chart based on these formations.
Like and comment if you find value in our analysis.
Feel free to post your ideas and questions at the comments section.
Good luck

AmazonSmile. You shop. And... Amazon Still Gives 😊 Amazon stocks are going up this year with solid 52.29% year-to-date gain, that is currently the 9th largest YTD result over all components of Nasdaq-100 ( NASDAQ:NDX ) index.
Work hard, Have fun, Make history - And You're Done! - This is the official tagline of Amazon in 2023.
The slogan refers to Amazon’s dedication to innovation and service enhancement. As can be seen, Amazon tagline 2023 is separated by three ideologies.
Have Fun
There is a saying that goes You gotta do what you love to love what you do, and I believe it much applies to this ideology – to have fun. The key to having fun at work is creativity and innovation.
Bezos makes room for mistakes, as long as they lead to something positive. You know what they say, learn from your mistakes and be better. To have fun is to think beyond the boundaries with a powerful imagination.
Make History
As of June 22, 2023, Jeff Bezos is the third richest person in the world, with a net worth of $149 billion, according to Bloomberg Billionaire Index data . Amazon proudly contributes to Bezos’ success, being the most successful retailer company in the U.S.A. Despite such accomplishments, the business still strives to develop bigger by the day.
From A To Z
You can still see a smile formed right under Amazon’s logo; it represents the range of products and services available on the platform. The smile also symbolizes consumers’ happiness when they find what they need within just a few clicks.
Of course, in Trader's terms a market smile also means V-shaped recovery, that is currently observed due to massive Reversed Head and Shoulders Chart Pattern structure breakout.
Overall Amazon stocks still are on the positive path, following the All-the-history support of 10-years simple moving average.

NASDAQ pulling back on high correlation with the July 2023 Top.Nasdaq (NDX) appears to be forming a Top approximately at the levels we described on our most recent idea (January 23, see chart below):
Today we move to the 4H time-frame where we can discuss the shorter term parameters of this expected pull-back. As you can see right away, the July 2023 peak (and the price action that led to it) is very similar to today's attempted technical peak formation. Both sequences started with an Accumulation Phase (green ellipse), rose and then had a 10-day correction and after a short re-accumulation (circle), they peaked on approximately a +6.80% rise. During all this time, they have been trading within a (dashed) Channel Up pattern.
In addition, the 4H RSI sequences between the two periods are virtually identical and we are now on the Lower Lows formation, where the actual index is below the 4H MA50 (blue trend-line), following the overbought 4H RSI peak. If the price continues to replicate the late July - early August 2023 sequence, then expect a Lower High and then sharp short-term correction below the 4H MA200 (orange trend-line). Target 1 is on Support 1 at 16560 and if we get a 1D candle closing below it, we will re-sell with Target 2 on Support 2 at 16200. That will be roughly a -8.67% decline from the top, similar to the August 18 2023 Low.
-------------------------------------------------------------------------------
** Please LIKE 👍, FOLLOW ✅, SHARE 🙌 and COMMENT ✍ if you enjoy this idea! Also share your ideas and charts in the comments section below! This is best way to keep it relevant, support us, keep the content here free and allow the idea to reach as many people as possible. **
-------------------------------------------------------------------------------
💸💸💸💸💸💸
👇 👇 👇 👇 👇 👇
NASDAQ: Is the correction starting?Nasdaq isn't overbought on the 1D time-frame anymore but technically it remains bullish (RSI = 63.538, MACD = 210.050, ADX = 41.826) and will continue to be as long as the two month Channel Up holds. It may be supported by the 1D MA50 but if the index follows the late July peak formation and crosses under the 0.382 Fibonacci level, then we expect a technical short term correction. The crossing will be our sell entry trigger and we will target the S1 level (TP = 16,200).
See how our prior idea has worked out:
## If you like our free content follow our profile to get more daily ideas. ##
## Comments and likes are greatly appreciated. ##