SPX Cash AnalysisWe're now getting a confirming signal that last week's top was at least a local top. Primary analysis (in Blue) however, because we did not make a new high in the SPX like the DJIA and NDX, the black (B) wave count is a valid EWT count. I do not favor the black pathway mainly due to our MACD signal, the other major indices hitting new highs, and lastly the price action I have as of today.
Best to all,
Chris
NASDAQ 100 CFD

$DJI now in short term downtrend, NDX, SPX & RUT already wereLooks like the TVC:DJI is in a short term downtrend.
NASDAQ:NDX SP:SPX & TVC:RUT all are in short term down trends which begin couple days or so ago.
TVC:VIX is at higher end of the recent pattern and it keeps poking it.
*(TOOK THIS FROM ANOTHER POST
Remember, the more something is poked the weaker it becomes
Picture paper holding a marble
Poke with a needle
Poke enough & that marble falls
Same works to the upside)*
The TVC:TNX or10 yr #yield looks to be setting up decently on the 4hr intraday.
#stocks

IXIC - Higher High Double Top Contained within this upward channel a double top could form at the top of this channel, however with it being a higher high we can assume further bullish movement after the double top proceeds.
A higher high suggests there is more steam left in the run. Which evidently there is a lot of steam for the NASDAQ.

NDX Nasdaq100 Fell 8.60% After the Last U.S. Credit Downgradeitch Ratings downgraded the US debt rating on Tuesday, moving it from the highest AAA rating to AA+, citing concerns about "a steady deterioration in standards of governance."
This downgrade happened following last-minute negotiations among lawmakers to reach a debt ceiling deal earlier this year, raising the risk of the nation's first default.
In the past, a similar credit downgrade had a significant impact on the NDX, which fell 8.60% in just two weeks. Back in August 5, 2011, Standard & Poor's, one of the major credit rating firms, downgraded U.S. debt after another major debt ceiling battle.
Jim Reid, a strategist at Deutsche Bank, pointed out that while the news of Standard & Poor's being the first to downgrade 12 years ago was substantial, investors had already adjusted their perceptions of the world's most important bond market, recognizing that it was no longer a pure AAA. Nonetheless, Fitch's recent decision to downgrade is still significant.
In the current scenario, the U.S. 10-year Treasury yield has risen to 4.15%, reaching its highest level since November 2022.
As for the price target for this year, it remains at $16650, as shown in the chart below:
Looking forward to read your opinion about it!

QQQ Nasdaq 100 ETF Price Prediction for 2024This was my price prediction for QQQ in 2023. I was bullish, but not enough:
Considerations about 2024:
In the July 2023 meeting, the FOMC chose to raise interest rates to a range of 5.25%–5.50%, marking the 11th rate hike in the current cycle aimed at mitigating heightened inflation. The prevailing consensus among market experts hints at a potential shift in strategy, suggesting that the Fed might commence rate cuts later in 2024 as inflation gradually aligns with the Fed's 2% target. Statistically, historical data indicates that approximately 11 months after the cessation of interest rate increases, a recession tends to manifest. This pattern places us around June 2024, aligning with my prediction of a dip in the QQQ to approximately $370.
Given that 2024 is an election year, there's an additional layer of complexity in predicting market behavior. Despite the anticipated mid-year dip, my inclination is that the QQQ will conclude the year on a bullish note. This optimistic outlook hints at the onset of a 3-5 year AI bubble cycle, with the QQQ boasting a year-end price target of $460.
The integration of artificial intelligence into various sectors is expected to catalyze market growth and innovation, propelling the QQQ to new heights by the close of 2024.

TARGET REACHED for Nasdaq at 16,956 now what?Nasdaq finally reached our first target of 16,956.
The price then started off on a bad note in 2024.
The USD is starting to strengthen again, which brings down the general markets.
So right now, there is no definitive price analysis for the Nasdaq.
We can only expect a form of consolidation to create the next pattern before it chooses a direction.
SO right now we are Neutral with a slight short term bearish tinge to it.

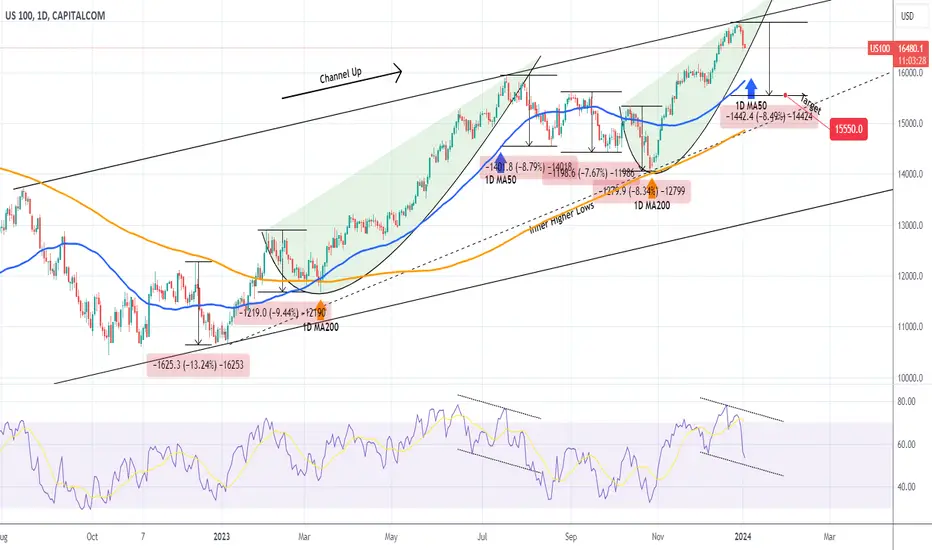
NASDAQ Hit the Channel's Top. Mid-term correction expected.Nasdaq (NDX) hit (and marginally broke above) its November 2021 All Time High (ATH), completing the expected Megaphone pattern we shared with you on November 16 (see chart below):
Last Thursday (December 28) the index hit the Higher Highs trend-line that started on the August 16 2022 High and can be treated as the top of a Channel Up pattern. The key here is the 1D RSI, which is developing a Channel Down, i.e. Bearish Divergence, similar to the July 19 2023 High.
As a result, it is highly likely to see a good medium-term pull-back, which within the Channel Up pattern has been around -8.50% on average. Such a decline would approach the 1D MA200 (orange trend-line). Our target is 15550.
-------------------------------------------------------------------------------
** Please LIKE 👍, FOLLOW ✅, SHARE 🙌 and COMMENT ✍ if you enjoy this idea! Also share your ideas and charts in the comments section below! This is best way to keep it relevant, support us, keep the content here free and allow the idea to reach as many people as possible. **
-------------------------------------------------------------------------------
💸💸💸💸💸💸
👇 👇 👇 👇 👇 👇
$DJI vs $NDX vs RatesSince the "outside" day. The DJ:DJI index has flip flopped above and below the top part of the outside day line.
It wants to push higher but when NASDAQ:NDX craters, like it's doing today, it's a lil tough.
Since we're doing intraday charts, let's do DJ:DJI as well.
What's the biggest thing that sticks out to you on the last chart?
Hint: Look at the bottom 2 panes.
It could all tie in with a bump in higher rates. IMO not a top. Not enough euphoria. But could be a short term top. We'll see.

Nasdaq - First Quarter Might Be Red➡️Hello Traders, welcome to today's analysis of Nasdaq.
--------
➡️I will only take a trade if all of the rules of my strategy are satisfied.
➡️Consider hitting that like button for more free, daily analysis. Your support means a lot!
--------
➡️Let me know in the comment section below if you have any questions.
➡️Keep your long term vision.

NASDAQ: Breached the 4H MA50. Sell signal.Nasdaq just crossed on the current 4H candle under the 4H MA50, which has been the short term Support since December 8th. Even though it turned neutral on its 4H outlook (RSI = 45.004, MACD = 31.260, ADX = 51.152), 1D remains bullish (RSI = 65.645) so a potential decline will serve as a technical pullback inside the seven week Channel Down.
The 4H RSI is already on a Bearish Divergence much like it was on the last Bearish Leg of November and a candle close under the 4H MA50 will validate the sell signal. Our target is the bottom of the Channel Up on an expected -2.88% decline (as the previous one) and potential contact with the 4H MA200 (TP = 16,480).
See how our prior idea has worked:
## If you like our free content follow our profile to get more daily ideas. ##
## Comments and likes are greatly appreciated. ##

Market Projection - NDX.My mid-term projection for NDX. I expect the market to have a major top next year. Level will likely differ but the path should be same in my opinion.

SPY WEEKLY 26th DEC 2023This is my analysis for SPY. If you have any questions let me know and I will try to answer it as quickly as possible.
NOTE:BE CAREFUL

Nasdaq Highest Weekly close The markets marched higher here for an 8th consecutive week.
this is the largest rally since 2017!
The Nasdaq closed the week at its highest ever weekly close.

NASDAQ Long-term Rising Wedge top approaching.Nasdaq / US100 is getting close to the top of the Rising Wedge pattern that started in August 2022.
The Triangle pattern formed inside displays similar features with the one tha peaked on February 2nd 2023.
That formation eventually pulled back to the 1day MA50 and 0.5 Fibonacci level.
Sell and target 15850 (expected contact with the 1day MA50).
Previous chart:
Follow us, like the idea and leave a comment below!!

Zoom (ZM) Looking to Breakout after Extended ConsolidationI really like this opportunity from ZM here. The stock is cheap on many metrics and the market is pricing in a bearish case. If ZM can post even minimal growth in 2024, the stock should rip.
We've had almost a year of consolidation in this $60-$74 range and we're attempting to break out. It's just a matter of time.
I'm targeting ~$97 to fill the gap made in August 2022. After such a long period of consolidation, a breakout should cause some short covering and bring in traders on a technical basis. If we break below the range, it would signal a failure and I would cut my losses
High probability trade
Target: $97 (+34%)
Stop Loss: $58 (-19%)
- Sultan of Chart

Can the MAGNIFICENT 7 outperform once more?We have seen the Magnificent 7 (Apple, Microsoft, Google, Amazon, Nvdia, Meta, Tesla) underperform on this rally since the October Low relative to the rest of the Nasdaq index (NDX). The former can be seen on the left chart while the latter on the right. This goes so far against the aggressive nature of the Magnificent 7 (M7), which have outperformed Nasdaq on all previous rallied by at least +50%.
In fact the M7's first major rally (2016 - 2018) rose by +150% while NDX's by +95%. The second major rally (2019 - 2021) registered +363% for MA7 and 'just' +185% for NDX. If there is any progression between them, we can argue that on M7 the rallies increase by a constant of (0.41) while on NDX by (0.51). Of course the sample isn't big enough for solid conclusions. But there is a Higher Lows trend-line on both that is driving this logarithmic growth. Especially for M7, it has been touched on all corrections.
As a result, a modest target estimate for both could be the 2.0 Fibonacci extension, which for M7 is 600.00, while for NDX 27500. Indeed those seem remarkable from the levels we stand currently but the projections can get even more inflated if we follow the 0.41 and 0.51 progressions respectively, which indicate that M7 could rise up to +511% (767) from the recent market bottom, while Nasdaq up to +279% (39700).
In any event, do you think the Magnificent 7 will start to outperform Nasdaq again after November - December's pause?
-------------------------------------------------------------------------------
** Please LIKE 👍, FOLLOW ✅, SHARE 🙌 and COMMENT ✍ if you enjoy this idea! Also share your ideas and charts in the comments section below! This is best way to keep it relevant, support us, keep the content here free and allow the idea to reach as many people as possible. **
-------------------------------------------------------------------------------
💸💸💸💸💸💸
👇 👇 👇 👇 👇 👇

NAS100 H4| Pullback support at 38.2% FiboNAS100 could fall towards a pullback support and potentially bounce off this level to rise towards our take-profit target.
Entry: 16,475.30
Why we like it:
There is a pullback support that aligns with the 38.2% Fibonacci retracement level
Stop Loss: 16,184.30
Why we like it:
There is a pullback support that aligns with the 61.8% Fibonacci retracement level
Take Profit: 16,891.90
Why we like it:
There is a swing-high resistance level
Please be advised that the information presented on TradingView is provided to Vantage (‘Vantage Global Limited’, ‘we’) by a third-party provider (‘Everest Fortune Group’). Please be reminded that you are solely responsible for the trading decisions on your account. There is a very high degree of risk involved in trading. Any information and/or content is intended entirely for research, educational and informational purposes only and does not constitute investment or consultation advice or investment strategy. The information is not tailored to the investment needs of any specific person and therefore does not involve a consideration of any of the investment objectives, financial situation or needs of any viewer that may receive it. Kindly also note that past performance is not a reliable indicator of future results. Actual results may differ materially from those anticipated in forward-looking or past performance statements. We assume no liability as to the accuracy or completeness of any of the information and/or content provided herein and the Company cannot be held responsible for any omission, mistake nor for any loss or damage including without limitation to any loss of profit which may arise from reliance on any information supplied by Everest Fortune Group.

OUTSIDE DAY for ALL major averagesWhat a turnaround for ALL the MAJOR averages!
As we've been saying over and over again.......
The END OF DAY IS WHAT MATTERS!!!
*Indices formed an OUTSIDE DAY*
Outside days can signify 2 things:
CONTINUATION
OR
REVERSAL (of the current trend)
Being that the day ended lower, LIGHT VOLUME though, we will take this as a WARNING!!!!!!!
RSI fell pretty hard, #stocks could just experience profit taking for a bit.
__________________________________________
TVC:VIX roaring & seems 2b stronger this time around.
TVC:DXY close to support and seems to be trying to base again.
2 Yr #yield showing positive divergence.
10Yr oversold - don't see anything out the norm in either one of these, yet at least.

Members Daily Analysis December 2025 Hours of Upside wiped out in 2 hours.
Bearish engulfing candles everywhere.
Yields Falling / Dollar rallying!

$RSP & $RUT performing better at the moment, vs $SPXAMEX:RSP vs AMEX:SPY
Equal weight vs regular #SP500
We can see that equal weight has been performing better
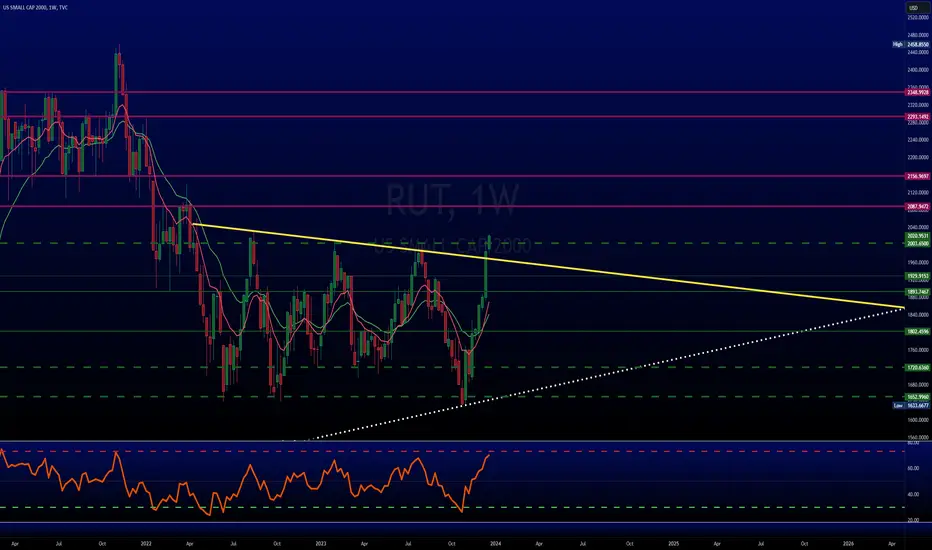
Russell 2000
TVC:RUT is no longer stuck in a rut :)
It had a fake breakout in the daily charts in August but look at it now.
That weekly is looking Nicely!
We've stated a few times that we believed these 2 would be moving better than normal averages.
We also said TVC:DJI would keep leading, it has. Another new All time high.
Another call, NASDAQ:NDX should surpass, it's more aggressive.
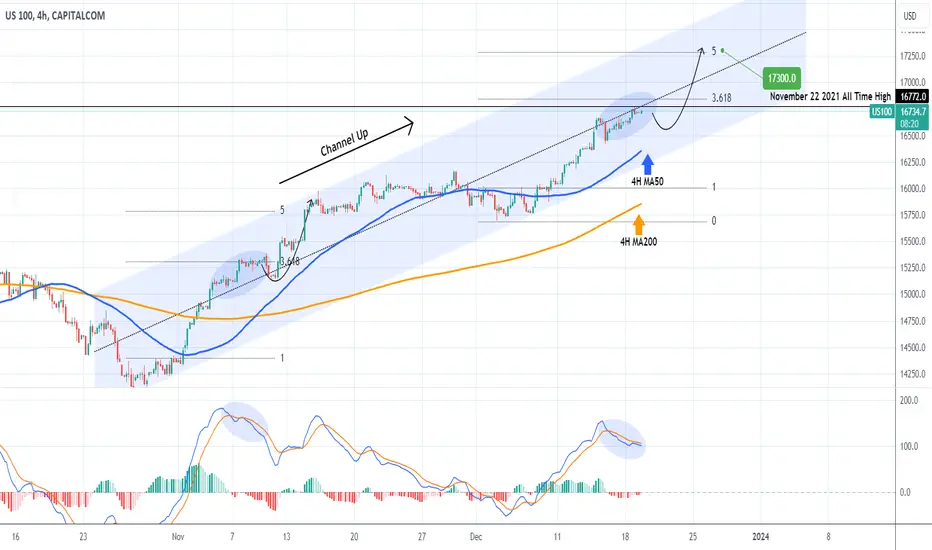
NASDAQ Hit the ATH but has one more push to give.Nasdaq (US100) hit yesterday the 16772 All Time High (ATH) level, reaching in the process our 16680 short-term target as shown on our December 11 call (see chart below):
The dominant pattern on the 4H time-frame is a Channel Up and the price is trading on its middle. As long as the 4H MA50 (blue trend-line) supports, any pull-back is a buy opportunity for at least one more push marginally above the 5.0 Fibonacci extension, as it happened on the November 14 pump. Our target is 17300.
-------------------------------------------------------------------------------
** Please LIKE 👍, FOLLOW ✅, SHARE 🙌 and COMMENT ✍ if you enjoy this idea! Also share your ideas and charts in the comments section below! This is best way to keep it relevant, support us, keep the content here free and allow the idea to reach as many people as possible. **
-------------------------------------------------------------------------------
💸💸💸💸💸💸
👇 👇 👇 👇 👇 👇
All time highs on NDX expected After holding a Optimal trade entry on the monthly chart - expect All time highs on NDX with higher target above in a few years. It will not be in 1 shot - but its something to keep in mind.
We will need to take it day by day, month by month, quarter to quarter and take seasonalities into account. Expect some type of pullback at some point- but will evaluate important levels to accumulate when possible to continue working toward the targets. Personally i day trade so will grab pieces of the pie day by day.

NASDAQ One opportunity to target 17300Nasdaq is trading inside a Channel Up.
The current Rising Wedge which is dring the price on the current bullish leg resembles that of October 27th - November 7th.
Trading Plan:
1. Buy on the current market price.
2. Sell below the MA50 (4h).
Targets:
1. 17300 (the 1.382 Fibonacci extension which was the target top of the mid November rise).
2. 15700 (Support 1).
Tips:
1. The MACD (4h) sequences among the two bullish legs are identical, confirming the bullish sentiment towards the 1.618 Fibonacci.
Please like, follow and comment!!
