Nasdaq 100 - Sell (Double Top, H&S Pattern, 0.618 Fib Extension)- Double top formation forming on the Daily/Weekly chart
- Head & Shoulders Pattern potential to form (2nd top in double top is the head of H&S patter)
- Price has reached Fibo 0.618 extension, potential area for reversal
- Mean reversion back to the long term trend line (excluding the inflationary impact of money
printing)
- News celebrating all time high, contrarian approach to avoid masses excitement/hysteria.
NASDAQ 100 CFD

US100 ~ Ho Ho Santa Rally or EOY Bah Humbug Bust? (4H)CAPITALCOM:US100 chart mapping/analysis.
Nasdaq 100 consolidating into key macro economic news, much like S&P 500.
Trading scenarios into EOY:
Bullish reaction to macro economic news = break above ~16167 trading range (yellow dashed) towards ascending trend-line (green) / red box confluence zone.
Bullish extension target(s) = new historical highs surpassing ~16770 November 2021 high.
Bearish reaction to macro economic news = break below ~15690 trading range (yellow dashed) + descending trend-line (light blue) towards 78.6% Fib / 200SMA dynamic support confluence zone.
Bearish extension target(s) = descending trend-line (white dotted) / ascending trend-line (green) / Golden Pocket confluence zone.

NASDAQ: Channel Up soon to test the ATH.Nasdaq is almost overbought again on the 1D technical outlook (RSI = 69.937, MACD = 245.100, ADX = 36.889) but that shouldn't affect it much as it is trading on the lower band of the November Channel Up. Leg 1 of the bullish sequence that made the Nov 15th HH extended to the 2.382 Fibonacci level. As the 1D RSI is identical to that Leg and shows that we are roughly halfway there, we remain bullish aiming again at the 2.382 Fib extension (TP = 16,840) which is marginally over the All Time High of 16,780.
## If you like our free content follow our profile to get more daily ideas. ##
## Comments and likes are greatly appreciated. ##

NASDAQ Targeting the ATH minimumNasdaq established its price action over the 4hour MA50 again.
A Channel Up is emerging, and could be a very aggressive one as the 4hour RSI is already overbought.
You can buy now and target at least the 16785 ATH.
If the price breaks over it and after re-testing it holds, re buy and target 17850 (+13.65% rise like the first leg of the Channel).
Previous chart:
Follow us, like the idea and leave a comment below!!

NASDAQ Last obstacle before a Christmas rally.Nasdaq (NDX) completed the short-term pull-back we called on our latest November 29 analysis (see chart below), hitting our 15750 target and then rebounding:
This rebound can seasonally be the start of the end-of-the-year rally, which the market calls 'Santa' or 'Christmas' rally. However, one last Resistance level remains before it is confirmed and that is the top (Lower Highs trend-line) of the (blue) Channel Up, which happens to also be synched with the Lower Highs trend-line of the 4H RSI.
If the index closes a 4H candle above it, we will buy and aim for a +6.34% rally (from the bottom), which has been the minimum bullish sequence since June, and target 16680 (Resistance 1), which is the December 28 2021 High, essentially the first Lower High of the 2022 Bear Cycle. A notch higher on that rally, the index can even test the 16770 All Time High.
On the other hand, if Nasdaq breaks below the bottom (Lower Lows trend-line) of the Channel Down first, most likely will have made contact with the 4H MA200 (orange trend-line) by then, we will sell instead and target 14900 (-7.60% from the Lower High, which is the minimum short-term decline since June).
-------------------------------------------------------------------------------
** Please LIKE 👍, FOLLOW ✅, SHARE 🙌 and COMMENT ✍ if you enjoy this idea! Also share your ideas and charts in the comments section below! This is best way to keep it relevant, support us, keep the content here free and allow the idea to reach as many people as possible. **
-------------------------------------------------------------------------------
💸💸💸💸💸💸
👇 👇 👇 👇 👇 👇

US Economy Has Entered A Potential Parabolic Phase End
I think this is the most important macro trend to pay attention to in our economic history, I see many 1930 comparisons with 2023 saying we are at the "1931" collapse point but all economic data is pointing that we are most likely at the 1927-1928 stage and crazy enough when you compare the macro trends they make the same giant symmetrical wedge pattern.
Now I'm going to share some archives of The New York Times from the same period to see where the mentality is.
--------
November 17, 1927
"98 and interest, to yield about 5.75%"
"temporary bonds"
--------
October 30, 1928
"London Paper Predicts Crash on Change There It Speculation Goes On.
LONDON, Oct. 29.—Speculative activity on the London Stock Exchange which sent prices of certain shares of doubtful value bounding upward, led the Daily Express to issue a solemn warning that a crash was certain to come unless the stock-gambling mania ceased."
--------
November 3, 1929
"SEES WALL ST. REACTION.
Stock Decline Will Aid Real Estate, Says Mandelbaum."
--------
November 25, 1929
"ASKS STATE INQUIRY ON STOCK RECESSION
Senator Hastings Wants the Governor to Name Committee of Business Leaders. MENTIONS SHORT SELLING But Finds Law Passed to Prevent It Failed of its Purpose and Was Repealed in 1857. Sees Short Selling a Factor Doubt As to Remedy."
--------
Here we are again different stages, different cycles.
But the main difference is our system bailed out our crashes since 2001 starting with interest rate cuts, we can clearly see the ups and downs are more violent when the FRED intervenes in the market.
Do I suspect we get a giant crash in a few years? unlikely the FRED will not debase / change the rules but stopping a new parabolic run up is much harder to stop.
They printed too much currency in 2020 now that inflation is halted via the fastest rate cycle in history where is all this capital going to flow into? correct equities and crypto.
Best to remember the 1929 quote of the thought of "Banning Short Selling" my guess is IF this starts to turn into a parabolic secular cycle ending the FRED will start to control the markets and limit ability to sell / short sell or QE / YCC the market during the final stage.
We will know if this is repeating if the wedge breaks out from now to early 2024.

$SPX at IMPORTANT area! DJ:DJI is fighting to stay above, hang around resistance.
NASDAQ:NDX came back & fighting to chug higher as well.
VERY IMPORTANT AREA for $SPX!!!!!!!
Strength has subsided but it's not down yet.
Could AMEX:SPY retest the highs?
TVC:VIX is holding but doesn't look fully awake. Hmmm...
#stocks AMEX:DIA NASDAQ:QQQ AMEX:SPY

Nasdaq about complete 5 wavesNasdaq needs one more high to complete yellow wave 5, right at the confluence with ext 2,00 green. Typically that means that all of wave 3 is about to complete. Next it will correct on wave 4

SPX and NDX may be getting into Golden Arches TerritoryDouble Top possibility here, expect it to be much more likely to occur if the US Dollar Index TVC:DXY moves back above the red box shown below:
This has been a long-time theory - if DXY moves above the 112-114 highs from a while back, we'll see double tops across many markets, crypto and stocks. Stocks may be the first to drop as they're already approaching their recent ATHs.
Should DXY move back down below 98-101, we may instead see new ATHs across markets and a sort of mega-boom before DXY eventually heads back up and leads to market crashes

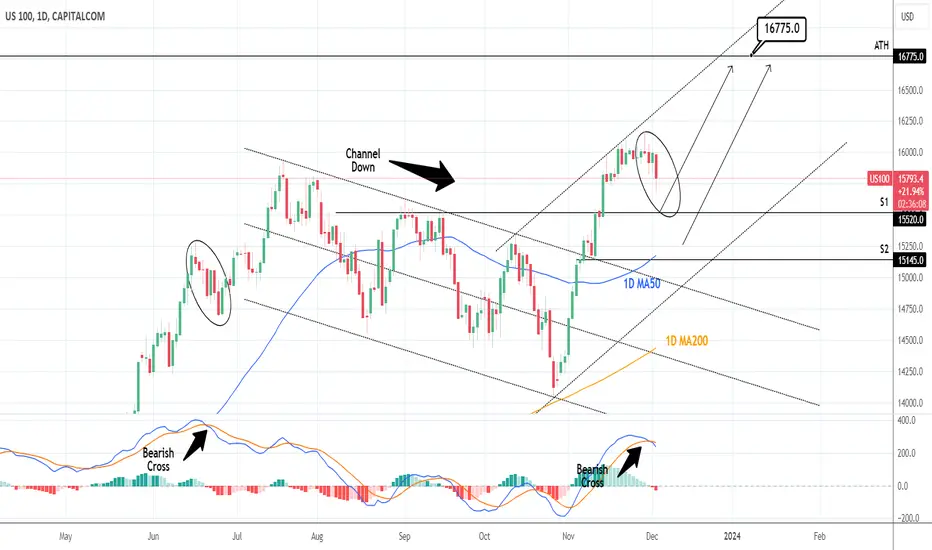
NASDAQ: Healthy pullback serving as end of year rally vessel.Nasdaq is pulling back today after the 1D MACD formed a Bearish Cross and the 1D technical outlook turned neutral (RSI = 54.419, MACD = 183.360, ADX = 45.724). This has so far achieved at offsetting the previous overbought condition on the chart. Technically it can be a HH rejection on a newly emerging Channel Up. This can serve as a buy opportunity either on the S1 level or if it is extended on the S2 and the 1D MA50 for the end of year rally. Our target is the ATH (TP = 16,775).
See how our prior idea has worked:
## If you like our free content follow our profile to get more daily ideas. ##
## Comments and likes are greatly appreciated. ##
Nasdaq 100 ETF (QQQ) ~ December 4H SwingNASDAQ:QQQ chart analysis/mapping.
QQQ ETF in consolidation phase after strong November rally.
Trading scenarios:
Further consolidation = descending trend-line (light blue) / multiple EMA confluence zone.
Continuation rally #1 = top range of Fib / ascending trend-line (green) confluence zone.
Shallow pullback #1 = 78.6% Fib / 200MA confluence zone.
Shallow pullback #2 = descending trend-line (white dotted)\
Deeper pullback #1 = gap fill / ascending trend-line (green) / Golden Pocket confluence zone.
Capitulation #1 = 50% Fib
Capitulation #2 = 38.2% Fib / gap fill / ascending trend-line (light blue) confluence zone.
Capitulation #3 = 23.6% Fib

📈 Nasdaq Future Insights 🚀The Nasdaq Future presents an intriguing chart. Following the completion of Wave 3 on July 19, 2023, we encountered a complex Wave 4 correction.
Since October 26, we've witnessed a parabolic surge, indicative of the initiation of Wave 1. Interestingly, there hasn't been a significant correction resembling a potential Wave 2. Therefore, I anticipate a downward movement to form Wave A, followed by a surge surpassing Wave 1 for Wave B. Subsequently, we might witness another dip before the completion of Wave C.
These corrective phases set the stage for the next upward trajectory toward new All-Time-Highs. Stay tuned for potential entry points during the corrective waves. 🕵️♂️🔥

NDX Local Head & ShouldersIf this local head and shoulders topping pattern plays out on NDX, we may expect lower prices still to come, most likely involving a closure of the CPI gap!

⚠️ Catastrophe Unfolding 2025-2028 Pre Warning. Detailed ⚠️
Posting this for anyone to view to see what's unfolding here, but everywhere I look I see alarm dangerous dangerous repeats of the roaring 20s on a scale larger than I could ever imagine.
I have hundreds of hours studying this ERA and although this looks great and no "Recession" what's coming is going to be much worse and change the world in a major way.
The reason a lot of the FRED charts don't backdate to 1920s is people would pick up on this and raise alarm bells, but because everything is going up like I suspected since early 2023, people are ignoring this.
Roaring 1920s
1920 Unemployment spike.
1923 rates trend close to ZERO.
1925 Markets stimulated crisis saved?.
Wrong people on the sidelines waiting for a recession got a case of FOMO and decided to re enter the market via leverage and heavy leverage creating an even bigger crisis.
1928 Rates start to rise as the bankers figure out this is not under control.
1930 finally the market breaks taking a dive forcing rates to get to ZERO again as fast as possible.
Roaring 2020s
2020 C19 crisis, unemployment spike.
2021 Rates globally forced to ZERO.
2022 Rates globally starting to rise to counter inflation.
2023 inflation contained (for now) majority of the market funds on the sidelines waiting for a recession. Hedge funds are NET SHORT stocks higher than COVID.
2024 No Recession, Rate Cuts money starts flowing back into markets heavily.
2024 is now packed filled with leverage of people who thought a recession was coming. FRED panics rising rates to contain bubble.
2025-2028 Crisis.
There's a reason Gold and Bitcoin are both moving up the same time equity markets are.
Smart money has already made the connection of how bad this is going to get.
The amount of money that will be printed soon to control market collapses + bond yields will debase your money faster than you can imagine.
So yeah while everyone is getting fanatic, make sure you allocate to the right assets that protect debasement.
Enjoy this final Roar, it could theoretically be the last one in our lifetime to flip wealth.

🍂Fall – Fell – Fallen. S&P500 Technical Perspectives over Q3'23The US government is well on its way to going into lockdown and shutting down the economy as policymakers are deadlocked over the national budget for the next fiscal year.
While leading stock market strategists are not yet terribly concerned about such perspectives, and entertain hopes that investors have a high probability of "getting away with it" with strong performance, in reality the facts tell a different story.
S&P500 SP:SPX is suffering losses, and has already lost about half of its annual growth since the beginning of 2023, and the Nasdaq-100 index NASDAQ:NDX reduced 2023 growth approximately by 30 percent.
To avoid a shutdown, Congress needs to pass all 12 spending bills for the next fiscal year by Sept. 30, something it has historically done rather poorly.
This could create problems for the market, which could immediately, that is, on the same day, be seriously affected by a US Government shutdown, considering SPX seasonality where September is one of the worst calendar month for investments into S&P500.
S&P500 Seasonality Chart
Meanwhile historical back test analysis says, in the past 20 government shutdowns, the S&P 500 stayed relatively flat, with the benchmark index losing an average 0.4% the week before a shutdown and gaining .1% by the end of a shutdown, according to a Reuters analysis of CFRA Research data.
And in some cases, stocks actually ended the shutdown period higher, with the market gaining a net 10% following the 2018-19 shutdown, according to Renaissance Macro.
Shutdowns lasting five days or more have also been known to see a quick market rebound, according to a 2021 Dow Jones analysis. On average, the S&P 500 had already moved into positive territory within one month of the shutdown. Shutdowns themselves are also relatively short. The last government shutdown, which was the longest-ever, lasted for 35 days.
Anyway everything could happened. To stay away, or look beyond the market's twists and turns in the weeks before, during, and immediately following a potential shutdown - this is could be very, very individual investment decision.
Technical pictures illustrates that weekly SMA(52) - 12 months simple moving average near 4150/4200 pp in SP:SPX or Dec'23 Futures CME_MINI:ESZ2023 (depends what are you looking for) could be quite strong support in any cases.

$NDX & $SPX momentum slowing down hardNASDAQ:NDX looks a little short term toppish.
Look at weekly NASDAQ:QQQ ;
Considering that the Nasdaq 100 went higher the RSI is much lower than previous top. Shows a serious slowdown in momentum.
Ditto for CBOE:SPX
However, the equal weight AMEX:SPY seems to have some room to go.
AMEX:RSP

NASDAQ Sell signal on 4H.Nasdaq is testing the MA50 (4h) since yesterday as the Rising Resistance weighs.
The middle line (dashed) of the Channel Up is the final level of Support before a short term pull back.
The Bearish Divergence on the RSI (4h), which is inside a Channel Down, is in favor of this short term pull back.
Trading Plan:
1. Sell if the price crosses under the dashed middle of the Channel Up.
Targets:
1. 15450 (Rising Support).
Tips:
1. The MACD (4h) is also descending while the index rises (another Bearish Divergence) and is about to form a Bearish Cross. Additional sell signal.
Please like, follow and comment!!

NASDAQ Small pull-back before final rally.Nasdaq (NDX) exceeded all expectations this month as following our November 01 buy signal (see chart below), not only did it hit the target but broke aggressively above the former Channel Down:
Since November 21 basically it has turned sideways, in an attempt to normalize the previous overbought 1D technicals. It has already hit the 4H MA50 (blue trend-line) and that is the first sign of exhaustion. If the 4H RSI gets rejected on its Lower Highs trend-line (testing it today), then expect a short-term pull-back, which we will short and target 15750 (-2.25% decline and above Support 1).
We take this target as during a similar 4H RSI Lower Highs rejection (September 15), NDX decline initially by -2.25%, similar also with the October 12 rejection. We expect this symmetry to play out at least on the short-term before the end-of-the-year rally, not necessarily on the long-term, where we need to see a 1D candle closing below Support 1, in order to signal a short towards the 4H MA200 (orange trend-line).
-------------------------------------------------------------------------------
** Please LIKE 👍, FOLLOW ✅, SHARE 🙌 and COMMENT ✍ if you enjoy this idea! Also share your ideas and charts in the comments section below! This is best way to keep it relevant, support us, keep the content here free and allow the idea to reach as many people as possible. **
-------------------------------------------------------------------------------
💸💸💸💸💸💸
👇 👇 👇 👇 👇 👇

US100 ~ Nov-Dec Snapshot (4H Intraday)CAPITALCOM:US100 chart mapping/analysis for last week of November.
TBC further details/write-up via ideas section, cheers.

NASDAQ Megaphone top and Bearish Cross call for a pull back.Nasdaq / US100 is trading inside a Megaphone pattern and has just hit its top.
A similar Megaphone in late 2022 - early 2023 got rejected on a proportional (to today's) top, followed by a 1day MACD Bearish Cross, which pulled the price back to the 1day MA50.
We are about to form a 1day MACD Bearish Cross on that exact same level.
Sell now and target the 1day MA50. Projected contact around 15400.
Previous chart:
Follow us, like the idea and leave a comment below!!

28112023 - #NDXNDX had a rather relatively large range day yesterday, as it initially moved down to the buy limit level given on Friday and went up before coming back down.
Overall, cautiously bearish for a move lower. Will be full short if we get a close below BZ.

24112023 - #NDXOverall, trend is still up; I have no strong views of the move for today. But 16069-16119 will be my sell zone while 15887 will be my buy zone. Trading these 2 extremes should work fine for today.

NASDAQ: Final phase of rise is starting. Santa's rally.Nasdaq has been rising since October 26th and the bottom on the HL trendline of the year long Channel Up. The 1D technical outlook is bullish after turning overbought on Monday (RSI = 68.584, MACD = 265.250, ADX = 67.453). So far its structure is much like the rise at the start of the Channel Up during the whole month of January.
That one peaked on the 1.5 Fibonacci extenstion from the last LH, while the 1D RSI turned flat above the overbought margin and reversed. However the 1.5 Fib made a +20% rise. The November rally is already fractionally over the 1.5 Fib with the RSI also reversed after being overbought but the +20% extension is far from being completed. It will be done at 16,870. Consequently if we don't get a strong rejection by Monday (tomorrow is early close), we will buy any 1D candle closing over the 1.5 Fib and aim at near +20% (TP = 16,850).
## If you like our free content follow our profile to get more daily ideas. ##
## Comments and likes are greatly appreciated. ##
