Nasdaq Breakout - Heading for new HighsNASDAQ has been in a triangle consolidation during the rotation trade, breakout today increases probability to new highs with a target of 350 in QQQ
NASDAQ 100 CFD

XAUUSD, NDX, XU100: Real Prices (Inflation Adjusted)A historical overview of inflation adjusted prices: XAUUSD, NDX, XU100USD
We are all blinded by "the price", and usually oblivious to the real price and real earnings.
As inflation silently erodes the market, it may be a cold shower to take a look in the long run.
The elephant in the room: the gap between the nominal and CPI adjusted price.

Nasdaq average returns (before and after) ThanksgivingBased on the observation that US equity markets tend to perform well heading into Thanksgiving, we decided to take a proper look at the figures. And it turns out, the Wednesday ahead of Thanksgiving tends to average the strongest positive returns of 0.54% with an 80.6% win rate.
The Nasdaq followed its seasonal tendency to rise on Monday, and closed at a 22-month high above 16k. Whilst Tuesday tends to be a down day, it has risen 52.8% of the time which explains the positive median return. But in a nutshell, the Nasdaq tends to rally into Thanksgiving and weaken the following Monday. And with RSI 2 and RSI 14 overbought alongside hype of strong Nvidia earnings, bulls may want to err on the side of caution next week - especially if we see a strong rally on Wednesday.

NasDaQ's New Highs & Next MoveNasdaq pushed up pass July's highest price last week. We want to keep an eye on it this week to see if there will be more buys to push price higher.
The only thing that can invalidate this setup is if the inside bar's or past sellers attempt to push the market down fails.
What do you think will happen next? Will the buyers keep price going or will the sellers come in strong?
*I love doing these videos so like the video and boost it to let me know if you like them too.*

DXY May Signal Next Crash Across Stock and Crypto MarketsWithin the four panels above are comparisons of major US market and the international Bitcoin indices with the US Dollar Index, $TVC:DXY. From top left to right:
TVC:DJI
SP:SPX
NASDAQ:NDX
BNC:BLX
As we can plainly see, each one acts a a near mirror image going back to 2017.
When looking at correlation via an indicator, like Correlation Coefficient, we would see regular swings from negative to positive on various timeframes and settings.
Yet, when viewing both indices over the years as shown above, there are several observations:
it becomes clear that there is a macro negative correlation between the dollar index and these major stock and crypto indices.
There is also a consistent tendency for both to correct and eventually meet near the middle and/or see a crossover to the other side.
Strong opposing reactions occur between these valleys of one meet or cross with peaks of the other (meeting in the middle or crossing), and when peaks of one drift furthest apart from valleys of the other.
DXY often reaches local highs or lows prior to these market indices reaching lows or highs, or vice versa. One can act to forward indicate the direction of the other.
It's certainly possible that any of these markets could instead signal DXY's next move, or even move together at the same time with it (both of which have occurred before and even in cases on the chart above).
However, there has been a pattern since 2017 of DXY making local highs or lows prior to the indices above making their local lows or highs, at least when leading up to major spikes in DXY and crashes in markets, bringing them nearer to the middle.
Should DXY move up and back above 105-106 and then 112, and continue, it may signal the end of these recoveries we've been seeing over the last year, and could point to crashes across markets.
My present theory is that we may see something like double-tops with slightly higher or slightly lower highs, across many of these markets, and as DXY ranges between 101-106. This, leading to a breakout of that range and a move back above 112.
Should DXY turn down hard instead, we may see extended recoveries and new ATHs until it bounces again off monthly support and heads back up.
Many of the stock indices shown above are already near double-tops with potentially a bit more room to run up. Bitcoin hasn't yet caught up and has a lower weekly RSI, so it may be the last one to make a strong recovery before we see a downturn.
*** related ideas linked in the related ideas section ****
Thank you for reading!
-dudebruh :)


Arbitrary LinesBabylon, the city where everybody spoke different languages.
In the end, Babylon met grave consequences.
(Macro perspective of the main chart)
Citizens of Babylon, in our case traders, can barely communicate.
They all speak in different timeframes, and with contradicting interests.
Which translator in their right mind can untangle spaghetti?
Many different lengths of regression.
How can any translator give a geographic position of anything?
Even if I try to make an argument...
... I am plotting arbitrary lines.
(bearish trendlines)
A line is nothing but weak. It can easily "disprove" what I have "proved".
(bullish trendline)
If we are to leap ahead, we must throw away all of which we are sure to be correct.
Surely there is something we can agree upon, right?
For I was conscious that I knew practically nothing...
-Plato
It seems that everything is based around the chaos theory.
The flight of a butterfly can affect tornadoes.
Traders (like me) fall in the trap of making chaos into facts and arguments, and conclude into definitive answers.
Clean and ordered answers taken out of chaos.
Ordo Ab Chao
Is anything/everything that we do a desperate attempt to revert entropy/chaos? Like an insane ritual?
Maybe we know nothing. Maybe making arguments and conclusions is meaningless.
Tread lightly, for this is hallowed ground.
-Father Grigori

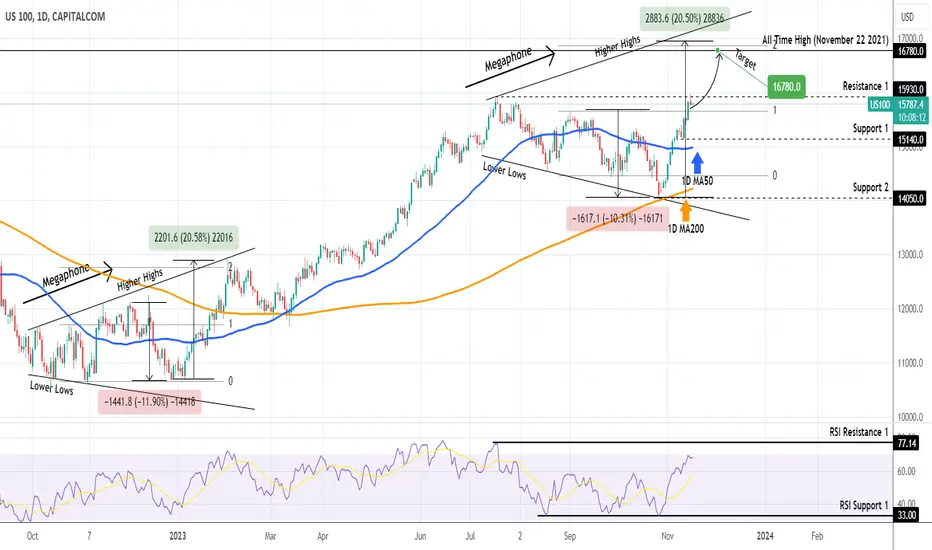
NASDAQ The target is no less than the All Time High.Nasdaq (NDX) smashed through our bullish target when we issued a buy signal (see chart below) 2 weeks ago:
Right now it is on a minor pull-back after hitting Resistance 1 (15930) yesterday, which is the July 19 High. That was the firs High of a potential Megaphone pattern and its structure so far resembles the Megaphone that formed the market bottom (October - December 2022) after the 2022 Inflation Bear Cycle.
Technically there are high probabilities that we are on the final bullish leg towards the Higher Highs trend-line, which in January 2023 extended as high as to complete a +20.50% rise. It also reached the 2.0 Fibonacci extension. A repeat of that magnitude would push the index marginally above the 16780 All Time High (ATH) of November 22 2021, and that is our current medium-term target.
-------------------------------------------------------------------------------
** Please LIKE 👍, FOLLOW ✅, SHARE 🙌 and COMMENT ✍ if you enjoy this idea! Also share your ideas and charts in the comments section below! This is best way to keep it relevant, support us, keep the content here free and allow the idea to reach as many people as possible. **
-------------------------------------------------------------------------------
💸💸💸💸💸💸
👇 👇 👇 👇 👇 👇
MSFT ~ Snapshot TA (Daily / Nov 2023)NASDAQ:MSFT chart mapping/analysis.
Bullish price momentum within an ascending parallel channel (green).
Bull target(s)
Breakout above ascending trend-line resistance (white dotted)
Upper range of ascending parallel channel (green)
Upper range of ascending parallel channel (light blue)
23.6% Fib + ascending parallel channel(s) confluence resistance zone
Bear target(s)
Underlying gap fills (~357.54 / ~339)
Ascending trend-line support (white dotted)
38.2% Fib
Lower range of ascending parallel channel (green)
38.2% Fib + parallel channel (green) confluence support zone
50% Fib
Gap fill (~280.39) + Golden Pocket Fib confluence support zone
Lower range of ascending parallel channel (light blue)

NFLX ~ Snapshot TA (Daily / Nov 2023)NASDAQ:NFLX chart mapping/analysis.
Bullish recovery back into ascending parallel channel (green).
Bull target(s)
Breakout descending parallel channel (white) + descending trend-line confluence resistance
Overhead gap fills (~470 / ~506.93 / ~566.88)
Golden Pocket Fib + gap fill (~506.93) confluence resistance zone
Bear target(s)
Underlying gap fills (~412.52 / ~354.79 / ~341.38)
Ascending trend-line support (light blue dotted)
38.2% Fib
23.6% Fib

NVDA ~ Snapshot TA (Daily / Nov 2023)NASDAQ:NVDA chart mapping/analysis.
Breakout/bullish price momentum pushing higher within an ascending parallel channel (green).
Bull target(s)
Golden Pocker Fib
Ascending trend-line resistance (white dotted)
78.6% Fib (+1)
Bear target(s)
50% Fib (+1)
Descending trend-line support (white dotted) aka "return to scene of crime"
38.2% Fib (+1)
Underlying gap fill (~423.81) + lower range of ascending parallel channel (green) confluence support zone
23.6% Fib (+1)
Lower range of ascending parallel channel (light blue) + gap fill (~306.01) confluence support zone

TSLA ~ Snapshot TA (Daily / Nov 2023)NASDAQ:TSLA chart mapping/analysis.
Continuation of bearish price momentum.
Bull target(s)
Breakout above 38.2% Fib
Overhead gap fills (~242.08 / ~289.52)
Descending trend-line resistance (white dotted)
50% Fib
Upper range of descending parallel channel resistance (white)
Ascending trend-line resistance (green dotted) aka "return to scene of crime"
50% Fib + trend-line/parallel channel "super" confluence resistance zone
Gap fill (~289.52) + Golden Pocket Fib confluence resistance zone
Bear target(s)
Ascending trend-line support (green dotted)
Descending trend-line support (white dotted)
23.6% Fib
Underlying gap fills (~162.95 / ~146.41 / ~122.63 / ~114.39)
Lower range of ascending parallel channel (light blue) + gap fills(s) (~146.41 / ~122.63) confluence support zone(s)

MV=PQ RevisitedHistorical data can be hard to compare against modern ones.
The longer back an analyst goes, the better the results of their analysis.
100 years of yield rate analysis may seem enough...
5000 years of interest rates however is a whole new story.
Money has been as cheap as it has been for the past 5000 years. Incredible numbers...
Source: www.trustnet.com
Fun Fact: Banks have existed since the early days of humanity!
Unsurprisingly, trading is not a modern invention.
Many agree that yield rates have been too low and equities too high.
Some go against the flow and suggest that the stock market bubble has yet to come.
I have been looking here and there, trying to find the reason the .com bubble was created in the first place. With that in mind I hoped that I would find when the next one will come...
Price has just skipped through the previous ceiling, and is now in a new territory. The drawn channel suggests that SPX hasn't reached the top of its channel.
There are many more comparisons that may suggest that equities haven't peaked.
By comparing DJA with one of its subsets (DJI) we have concluded that the DOW hasn't saturated yet. This analysis above is as classical as it gets.
While many thought equities would die ...
... the Bane of Traders has trapped many of us, myself included.
Big-Tech dominance inside Nasdaq Composite suggests that a .com bubble may be brewing inside IXIC, just like we saw in SPX/CPIAUCSL in 1994.
Onto the basics of financial now.
MV=PQ is one of the foundations of how economies function.
For more information read my previous idea:
For simplicity reasons, we merge PQ. I don't have financial data for each one of them.
PQ for the US is considered as the GDP. Another example of GDP can be SPX, which extends beyond the limits of US soil.
GDP has been slowing down...
USGDP is the total cost of all products produced in the US. A slowing GDP means a slowing net-production of the US market. If productivity hasn't changed significantly in the past decade, a slowing GDP may be due to falling prices. And with yield rates nearing zero in 2020, we can safely say that inflation has turned negative in the US.
A slowing GDP may also mean that equities have slowed down. This gives more importance to the incoming-equity-bubble scenario. An equity bubble may come for some, but not for all.
The tide has turned in favor of NDX against IXIC, and DJI against DJA. Charting suggests wealth accumulation in a smaller part of the main idices.
GDP may be breaking out.
With money velocity (main chart) in record-low values, we can expect faster money flow in the years to come. That means increased productivity/inflation/GDP.
As expected, long-term inflation may also be breaking out of its decreasing trend.
Don't forget: High inflation may be a problem for some. An increased GDP growth caused by high inflation will certainly help the chosen big-ones. There cannot be high GDP with nobody profiting from it.
To get rich you must inherit or steal. -Aristotle Onassis
In the end, trading hasn't changed at all in 5000 years. There are still pirates, kings, queens, emperors and peasants. Markets will march upwards with or without us.
Tread lightly, for this is hallowed ground.
-Father Grigori

Strong Cup & Handle pattern on the weekly $IXIC chartToday witnessed a robust bullish surge in the Nasdaq with a cup and handle pattern (Very similar on the S&P500 too).
Introduced in 1988 by analyst William O’Neill, the cup and handle pattern signifies a bullish continuation pattern activated by consolidation following a robust upward trend. While the pattern requires time to evolve, its recognition and subsequent trading become relatively straightforward once it materializes. As with all chart patterns, trading volume and supplementary indicators should be employed to validate a breakout and the sustained bullish trajectory.
To validate the pattern, adherence to several rules is imperative:
- The cup with handle pattern must follow a significant bullish movement (Checked: +130% in 87 weeks).
- The lowest trough of the cup must be below 50% of the preceding bullish movement (Checked: -37%).
- The lowest trough of the handle must be below 50% of the cup’s height (checked: -13%).
Key statistics on cup with handle patterns, courtesy of CentralCharts, include:
In 79% of cases, the exit from a cup with handle pattern is bullish.
In 73% of cases, the cup with handle pattern’s price objective is reached (half the cup’s height), after breaking the neck line.
In 74% of cases, after exit, the price makes a pullback in support on the neck line.
In summary, the cup and handle pattern signifies a bullish continuation pattern, initiated by consolidation after a robust upward trend. While its development requires time, once formed, recognition and trading are relatively straightforward. Employing trading volume and additional indicators is crucial for confirming a breakout and sustaining the original bullish price movement.
PS: I think that a perfect cup and handle pattern would be form on the breakout of the 14300 neckline

The Emperor's New ClothesYou don't need to believe in fairytales to realize that there are kings, queens and peasants.
As if not a single day has passed since the Medieval times. Poor get poorer, and rich get richer.
As the folklore said, the emperor decided that he needs new clothes.
And so he demanded from the entire kingdom that he finds the finest.
Two swindlers arrive at the capital city of an emperor who spends lavishly on clothing at the expense of state matters. Posing as weavers, they offer to supply him with magnificent clothes that are invisible to those who are stupid or incompetent.
Source: Wikipedia
And here we are. Looking at the magnificent clothes of the naked emperor.
The emperor however is still an emperor, no matter what he wears.
And he gets to enjoy the fruit of his peasants' labor.
Post 2020 profits for the naked few.
Until today, we are too smart not to see the clothes of the emperor.
No sane person can possibly call themselves incompetent.
The ghost of the emperor lives on...
...until one child realizes, that there are no clothes in the first place.
We have reached the very last days of the emperor's dignity.
Trend change begins when only one changes direction. Others soon follow.
Volatility increases after a tiny "butterfly-event" causes one member to destabilize.
SPX Stability:
Then volatility swallows everyone.
Parasites have riddled the economy.
There is only a limited amount of time for parasites to feast.
The time will come, when there will be no food left.
It is at that time when the real "fun" begins...
Tread lightly, for this is hallowed ground.
-Father Grigori

NDX - Horizontal Trend Channel💡 Pattern: Cup & Handle
💡 RSI: 57 Neutral
💡 Risk: Medium
✅ Resistance: 15800
✅ Support: 14100
PERFORMANCE
🔴 ST: NEGATIVE
🟡 MT: HOLD
🟢 LT: POSITIVE
*ST: Short-term | MT: Mid-term | LT: Long-term
Verify it first and believe later.
WavePoint ❤️

14112023 - #NDXTrend is up till it is not. NDX seemed somewhat weak but recovered nicely. Anything can happen for CPI but overall, as long as price is above BZ, trend is up. 15353 will be a low risk level to go long (especially on a CPI dip) for a move higher with 15861 as a possible magnet level.

SPX And The CPI WeekThe S&P500 index SPX surged by +1.31% last week to close above 4400 resistance level. The index is showing that there's more potential is yet to come, to hit 4520 next.
The week ahead:
The meeting between US President Biden and China President Xi is the highlight; there is also US CPI and retail sales, the former being a key input into the Fed's policy deliberations; China activity data will also be released.
Sectors that may witness higher volatility are; Big techs, EVs, Oil & Gas and Semiconductors stocks.

META ~ Snapshot TA (Daily / Nov 2023)NASDAQ:META chart mapping/analysis.
Bullish consolidation higher within an ascending parallel channel (white).
Bull target(s)
Breakout above descending trend-line resistance (white dotted)
Overhead gap fill (~361.59)
Prev ATH + upper range of parallel channel (light blue) confluence resistance zone
Bear target(s)
Ascending trend-line support (green dotted)
Golden Fib Pocket
Lower range of ascending parallel channel (white)
50% Fib
Underlying gap fills (~214.11 / ~201.03 / ~183.78)
38.2% + gap fill (~201.03) confluence support zone

GOOGL ~ Snapshot TA (Daily / Nov 2023)NASDAQ:GOOGL chart mapping/analysis.
Multi-year consolidation/pennant pattern formation.
Bull target(s)
Overhead gap fill (~137.42)
Descending trend-line resistance (white dotted) - plus breakout? TBC
Previous ATH + upper range parallel channel (light blue) confluence resistance zone
Bear target(s)
23.6% Fib + gap fill (~126.49) confluence support zone
Ascending trend-line support (green dotted)
Underlying gap fill (~117.71)
38.2% Fib + gap fill (~112.94) confluence support zone
Ascending trend-line support (white dotted)
50% Fib
Golden Pocket Fib

AMZN ~ Snapshot TA (Daily / Nov 2023)NASDAQ:AMZN chart mapping/analysis.
Consolidation within ascending parallel channel (green).
Bull target(s)
Ascending trend-line resistance (white dotted)
Upper range of parallel channel (green) + 78.6% Fib confluence resistance zone
Overhead gap fill (~163.27)
Bear target(s)
61.8% Fib
Underlying gap fills (~133.57 / ~121.64)
50% Fib
lower range of ascending parallel channel (green)
38.2% Fib
Upper range of descending parallel channel (light blue)

AAPL ~ Snapshot TA (Daily / Nov 2023)NASDAQ:AAPL chart mapping/analysis.
Clear breakout of descending parallel channel (white).
Bull target(s)
Overhead gap fills
Previous ATH (~197.70)
Ascending trend-line resistance (green dotted)
Upper range of ascending parallel channel (light blue)
Bear target(s)
Descending parallel channel (white) aka "return to scene of crime"
23.6% Fib
Ascending trend-line (green dotted) + 38.2% Fib confluence support zone
Descending trend-line (white dotted)

Nasdaq100 Ahead Of Fed- The Nasdaq 100 index declined 2.60% last week, yet closed above the 14,000 major weekly support.
- Ahead of the Fed, quarterly bond sales plan and Apple's earnings; the mentioned support (represented in both: the 50-EMA and the downward channel's lower boundary) would play an important role in deciding the market's path on the short/medium-term.
- The technical indicators suggesting an upward rebound targeting: 14,520- 14,700 resistance levels.
