WTI Crude Oil All Time Chart. Does History Repeat Itself..?!I'm writing this article, because of the striking resemblance with Today's oil and the one that has been a lot of times before..
I believe that history repeats itself, and there are lessons to be learned. And since this boom and bust cycle are not new, it might also provide some understanding on where we are heading.
I hope you enjoy.
The time of dinosaurs
In the 1850s the whale fisheries had failed to keep pace with the mounting need for illuminating oil, forcing the price of whale oil higher and making illumination costly for ordinary Americans. Only the affluent could afford to light their parlors every evening.
There were many other lighting options such as lard oil among others but no cheap illuminant that burned in a bright, clean, safe manner.
George Bissell, considered as the father of the American oil industry, had the intuition that oil that was plentiful in western Pennsylvania could be a first rate illuminant. The slimy liquid was so ubiquitous that it tainted well water and plagued local contractors drilling for salt.
In 1855, Professor Benjamin Silliman from Yale produced a report that vindicated Bissell's hunch that oil could be distilled to produce a fine illuminant (like kerosene), plus a host of other useful products. As a result, Bissel and his company, Seneca Oil Company (formerly the Pennsylvania Rock Oil Company) needed to dispatch someone to Pennsylvania to look for large pools of oil.
First oil drilled in America
That man was Colonel Edwin Drake, known as the first to successfully drill for oil. Drake arrived in Titusville, Oil Creek Valley. Oil was known to exist here, but there was no practical way to extract it. Its main use at that time had been as a medicine for both animals and humans. Natives used it for war paint and for soothing skin liniment. It took a couple years but Drake struck oil in 1859.
This was the beginning of a pandemonium. Bands of fortune seekers and speculators streamed into Titusville and other oil-related businesses quickly exploded on the scene.
I guess we can call this the Klondike of oil, as a beginning of Global Industrialization Era.
Mr. Rockefeller was known as the co-founder of the Standard Oil Company and was the world's richest person. Crude oil jumped multi X times in 1860s from approximately 50cents per barrel in early 1860s to over 3 dollars in late 1860s.
Additionally, I would like to note that crude oil fluctuated between $10 and 10¢ a barrel in 1860! Adjusted for inflation, Mr. Rockefeller fortune upon his death in 1937 stood at $336 billion according to Fortune (in 2008 U.S. dollars).
Similar how crypto enthusiasts built their wealth in 2010s, right? 😉
Pump and Dump
By the late 1860s, there was a slump in the oil industry, keeping it depressed for the next five years. Low kerosene prices, a boon to consumers, were catastrophic for refiners, who saw the profit margin between crude and refined oil prices shrink to a vanishing point.
Worse, the oil market wasn't correcting itself according to the self-regulating mechanism described by neoclassical economists. Producers and refiners didn't shut down operations in the expected numbers.
John D. Rockefeller said "So many wells were flowing that the price of oil kept falling, yet they went right on drilling." Rockefeller tirelessly mocked those "academic enthusiasts" and "sentimentalists" who expected business to conform to their tidy competitive models.
One Hundred Years of Resistance for $4
According to the standard model of competition, as oil prices fell below production costs, refiners and producers should have shutdown.
But the oil market didn't correct itself in this manner because refiners and producers carried heavy bank debt and other fixed costs and by operating at a loss they could still service some debt. Each refiner, pursuing his own self-interest, generated collective misery.
Does it sound like today's crypto news, right? 😉
The U.S. drilling activity didn't slow down after hot 1860s as much as expected and a lot of producers are still pumping oil to avoid defaulting on their loans..
There was World War I in 1914-18, and total number of military and civilian casualties was around 40 million - around 20 million deaths and 21 million wounded. 😓
There was World War II in 1939-45, and total number of military and civilian casualties estimated around 50 - 56 million.. 😓
Crude oil prices jumped again, and again. But still remained below $4 until 1970s, as there were no all time peaks in crude oil after super hot 1860s.
Money-printing Era Breaks the Rules
The gold standard was the basis for the international monetary system from the 1870s to the early 1920s, and from the late 1920s to 1932 as well as from 1944 until 1971 when the United States unilaterally terminated convertibility of the US dollar to gold, effectively ending the Bretton Woods system, that has been resulted with huge inflation all over the world within further decades..
Technical pictures at the main WTI crude oil chart illustrates, oil price are on the sustainable path since then, with huge bullish accelerations within local and global conflicts, like Arab-Israeli War in 1973, 9/11 attacks in 2001 and Russia-Ukraine conflict in 2022.
Nowadays
Knee-jerk surge’ happens again, and again, so oil experts repeatedly predict market impact of new 2023 Israel-Hamas conflict.
Crude oil price sees a spike on early Monday trading Oct 9, 2023 so the overall impact of the attack on Israel by Palestinian militants Hamas has yet to consider...
In a conclusion.. Does history repeat itself..
Certainly "Yes". As lessons of history still remain unlearned.
NASDAQ 100 CFD

RUT/NDX ratio tells you to keep investing in tech!Something a little different today.
Was looking a some stock ratios and decided to regress the standard Russell 2000 against the risky technology index, the Nasdaq.
This RUT/NDX ratio has been inside a Channel Down since the Dotcom Bubble send it sky high, collapsing the tech sector.
The Channel Down has never been broken since and made a new Low this month.
What does this tell you? Keep investing in tech!
Follow us, like the idea and leave a comment below!!

NASDAQ Wait for the right sell entry at the top of the Wedge.Nasdaq is rising after the price found Support at the bottom of the Falling Wedge.
It is approaching the MA200 (4h) but the technical Resistance is inside the 0.618 Fibonacci level and the Falling Resistance.
Trading Plan:
1. Sell at 15170 (Fibonacci 0.618).
Targets:
1. 14900 (pull back to the MA50 4h).
Tips:
1. Only a crossing over Resistance (1) can restore the bullish trend. Until then the index may even turn sideways inside a Rectangle for a while.
Please like, follow and comment!!
Notes:
Past trading plan:

Nasdaq Trading IdeaBased on Simple Technical Analysis ( Trendline + Support & Resistance )
Risk Disclaimer:
Please be advised that I am not telling anyone how to spend or invest their money. Take all of my analysis as my own opinion, as entertainment, and at your own risk. I assume no responsibility or liability for any errors or omissions in the content of this page, and they are for educational purposes only. Any action you take on the information in these analysis is strictly at your own risk. There is a very high degree of risk involved in trading. Past results are not indicative of future returns. Good luck :-)

NASDAQ Reality will soon hit those who bet against the market.Nasdaq (NDX) has been on a 3-month correction since its July High. No need to mention that this High almost touched its All Time High (ATH), almost recovering in less than 1 year the value lost in the Bear Cycle.
** 2010 Higher Lows and Megaphone **
The Higher Lows (dashed) trendline that has been in place since 2010 after the recovery from the 2008 - 2009 Housing Crisis started, held during the 2022 Inflation Bear Market and gave way to a Channel Up. We can claim that since mid-2018 the market entered into a Bullish Megaphone pattern and such Channel Up formations have been the common vessels to a Higher High.
** Uncertainty/ Doubt / Disbelief **
Similarly common have been minor (on a 1W scale) corrections such as the pull-back we are witnessing since July. During market uptrends, those are called 'Bull Flags'. Especially in the beginning of the recovery those are met with Uncertainty/ Doubt / Disbelief. For that reason the majority doesn't get in on the trend until it is well underway. Even the 1W RSI shows how consistent this Symmetrical Support Zone has been throughout all those Channels. Even the Higher Lows trend-line from May 2022 is still holding.
** First Bullish Cross since 2010 **
On top of all the above, Nasdaq is about to completed a 1W MA50 (blue trend-line)/ 1W MA100 (green trend-line) Bullish Cross, the first since February 2010 (which as mentioned is post Housing Crisis). The price will enter next week into green Ichimoku territory, which when formed indicates significant upside potential on a well establish bull trend.
We expect this to be the end of the 3-month correction and the resume of the uptrend. Based on the previous runs, NDX is aiming at 17800 towards the Christmas rally and 21500 in Q3 2024.
-------------------------------------------------------------------------------
** Please LIKE 👍, FOLLOW ✅, SHARE 🙌 and COMMENT ✍ if you enjoy this idea! Also share your ideas and charts in the comments section below! This is best way to keep it relevant, support us, keep the content here free and allow the idea to reach as many people as possible. **
-------------------------------------------------------------------------------
💸💸💸💸💸💸
👇 👇 👇 👇 👇 👇

What's a Tea! Fed Policy Expectations Plunge Gold to Key SupportGold declined marginally by 3% in September hitting its major support of 52 weeks SMA, in the face of higher long term Treasury yields TVC:TNX and a stronger Dollar index TVC:DXY .
Sentiment remained weak for most of the month as ETFs continued to lose AUM while COMEX managed money net long futures positions fell to a five month low previously in August 2023.
👉 Since July, long-dated yields have risen faster than short-dated yields, meaning the yield curve is exhibiting a "bear steepening", something often seen during a reflationary or early business cycle period.
👉 Following this thesis, lets compare 13-Weeks Treasury Bills Yield CBOE:IRX.P that jumped in 3 months from 5.150 to 5.330 only, and 10-Years Treasury Notes Yield TVC:US10Y with gains from 3.820 to 4.630 at the same time.
👉 While gold tends to underperform risk assets during these periods, it is not common to see bear steepening this late in the business cycle and recent moves in yields may be masking other factors at play, such as higher risk premiums
👉 Soft US economic data suggests also that a slowdown is still likely, which, alongside a potential change in the shape of the yield curve, could signal an environment where gold has historically performed well.
Yields take center stage
👉 August and September were challenging for gold. After dipping below US$1,900/oz, it staged a late recovery – around the Fed’s Jackson Hole annual symposium, than turned more down after Fed's September Meeting to finish September down approximately by 3 per cent.
👉 The US Treasury yield curve is arguably the most important financial indicator around, and its trajectory and shape are constantly under scrutiny. Most of the time (90%) it slopes upward as investors need to be compensated for lending their money for longer. But at these times, it inverts. As it has since July 2022, suggesting bond market participants are waiting Fed's monetary policy tightening continuation.
Lets Compare
Gold Spot in U.S. Dollars (RHS) vs. 6-Months Fed's Policy Expectations based on Jun'24 30-Days Federal Funds Futures CBOT:ZQM2024 (LHS)
Gold Spot in U.S. Dollars (RHS) vs. 12-Months Fed's Policy Expectations based on Dec'24 30-Days Federal Funds Futures CBOT:ZQZ2024 (LHS)
What’s next
👉 In summary, the move in the 10-year yield can likely be attributed to three main factors. A shift up in the ‘higher interest rates for longer’ narrative, supply and demand forces and a rise in the risk premium.
👉 The latter factor might start to provide support to gold prices, if it continues to increase from its key support of 52W SMA.
👉 If we simply look at bear steepening, gold tends to underperform – with low single digit average returns. Historically, the most likely successor to a bear steepening is a bull flattening (approx. a third of the time). This is characterized by a fall in the long end of the curve relative to the short end, effectively an unwinding of the rising premia we’ve witnessed.
👉 This partly took place at the latter end of September with gold likely benefitting from such yield declines. Also, soft data continue to suggest that a slowdown is still firmly on the cards. This could result in either a bull steepening or a rare "bear-". Both phases have on average been gold friendly, yielding an annualized return of 15% – the highest of all the phases.
Gold Market Breath
👉 What is Market Breath overall?
👉 Market Breath is a Percentage of Index Components Trading Above their N-Period Moving Average.
👉 Traders can use this index to see what percentage of index components are trading above their N-period moving average, for example, above the 200-day moving average.
👉 A rise above 50% in the indicator indicates increased market strength, while like the index of new highs and lows, traders and investors often look for extreme values to find extreme overbought and oversold conditions in the broader market.
👉 Gold Market Breath Indicator INDEX:YATH (number of S&P/TSX Global Gold Index TSX:TTGD above 200-Day SMA) is at 2.43, that is one of the lowest multi year readings .
In conclusion, there are some reasonable considerations for further Gold spot purchases following the thesis that 52W SMA is a strong support for Gold in 2023, and further Fed's Policy expectations for upcoming 2024 are fully in the hands already.

$DXY topping short term?Good Morning!
Trying to get an idea of where #stocks may go. IMO bias is up BUT we cannot be deterred by biases, can we?
TVC:DXY
4Hr is showing weakness.
Circles = moving avg bear crossovers.
We see the quick drops BUT they RECUPERATE hours later.
The 2nd chart shows DAILY vs 4Hr.
Makes it easy to see how decent the drops are.
TVC:DJI TVC:NDQ SP:SPX

NASDAQ Small glimmer of hope as 1D making a MACD Bullish Cross.Nasdaq (NDX) recently broke below the Higher Lows trend-line of 2023, the trend-line from the start of the year that has been supporting the strong recovery. This created the conditions for further decline, especially since the 4H MA50 keeps the price action below it, but so far Support 1 (14430) is holding.
The above levels are those we will use as break-outs. A candle close below Support 1 will be a sell signal, targeting the 1D MA200 (orange trend-line) at 13900. Since however the 1D MACD is close to forming a Bullish Cross, the bullish momentum attract probabilities and if a candle closes above the 1D MA50, we will instead buy, targeting 15650 (Resistance).
The pattern since mid August is quite similar to the Arc formation of November - December 2022. After the 1D MA50 broke, it targeted the previous Resistance and even hit the 1.382 Fibonacci extension before the next pull-back.
-------------------------------------------------------------------------------
** Please LIKE 👍, FOLLOW ✅, SHARE 🙌 and COMMENT ✍ if you enjoy this idea! Also share your ideas and charts in the comments section below! This is best way to keep it relevant, support us, keep the content here free and allow the idea to reach as many people as possible. **
-------------------------------------------------------------------------------
💸💸💸💸💸💸
👇 👇 👇 👇 👇 👇

Bear rallies the most furious, could be in one!Bear rallies tend to be the MOST FURIOUS!!!
Be careful but take ADVANTAGE!!!
SP:SPX upcoming resistance @ 3 areas:
4280
Moving avg is a little above that (weakest resistance imo).
MAJOR = 4330 (it closes above this will post further levels).
Keep an eye as the RSI closes in on 50.
#stocks DJ:DJI TVC:NDQ TVC:RUT TVC:VIX TVC:DXY TVC:TNX #GOLD #SILVER

$DXY trading alongside $TNX & both divergent to Stocks Post #2TVC:DXY on left in all charts (only DJI shown here)
DJ:DJI & CBOE:SPX & TVC:TNX on right.
Short term we are badly due for some sort of relief rally, we nibbled in this area AMEX:UDOW AMEX:SPXL
Not sure how high this can go so we have been nibbling and will sell in tranches.
#stocks TVC:NDQ AMEX:DIA AMEX:SPY NASDAQ:QQQ

$DXY makes history (Update idea) Post #1Historically, the YELLOW support area NEVER holds when TVC:DXY is on its way back down.
HOWEVER, the US #Dollar is showing strength. (this is vs a basket of currencies that are also weak.) 1st time it bounced back this hard.
This looks like it wants to keep going, longer term. We'll see.
This is NOT good for #stocks (longer term).
TVC:TNX has been trading closely.

NQ: Downside target 14450 is a buyNQ should find support at 14450 which should provide a relief bounce to 15190.

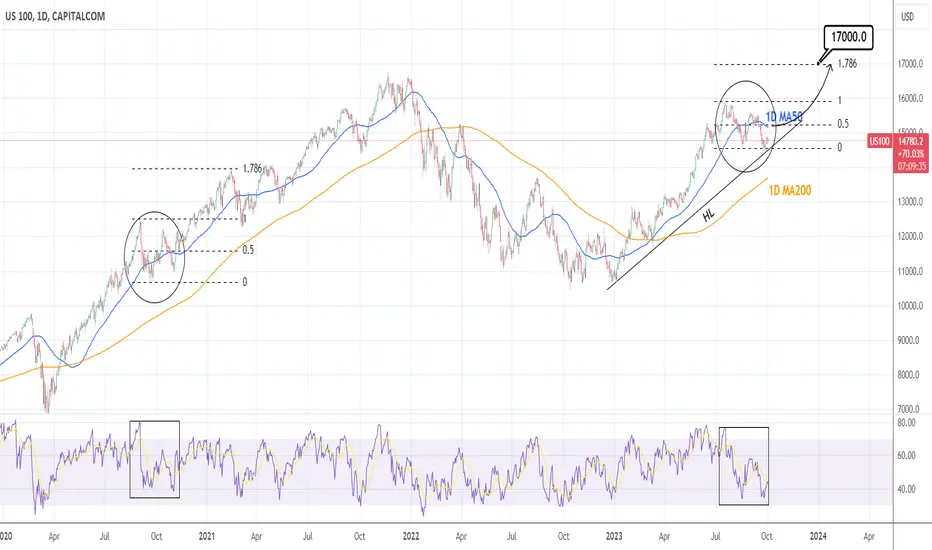
NASDAQ: Can hit 17,000 if the 1D MA50 breaks again.Nasdaq remains bearish on the 1D timeframe (RSI = 40.412, MACD = -138.180, ADX = 35.654) but it is on the HL trendline, the supporting trendline that emerged on the December 28th 2022 low. According to the 1D RSI, comparisons can be made with the September-October 2020 consolidation fractal around the 1D MA50, following the COVID recovery. After the 1D MA50 got crossed over for the second time, the index went on to reach the 1.786 Fibonacci extension level before the next consolidation.
If the HL holds and the index breaks over the 1D MA50 again, we will have a strong long term bullish case in our hands and target 17,000 (Fibonacci 1.786).
## If you like our free content follow our profile to get more daily ideas. ##
## Comments and likes are greatly appreciated. ##
NASDAQ Double bullish targetNasdaq / US100 is consolidating around the 4hour MA50. It is a similar Cup and Handle pattern with August 24th.
Buy and target 15050 (4hour MA200). Then wait for a 1day pull back. Re-buy and target 15330 (Fibonacci 0.382) under the Falling Resistance.
RSI patterns identical, both showing we are in the phase of the 4hour MA50 consolidation.
Previous chart:
Follow us, like the idea and leave a comment below!!

$NDX Quarter 3 (Q3) AnalysisThe NASDAQ has been performing extremely well for the year, and a special rebalance was put into effect in July to slow down the NASDAQ’s growth. Currently the NASDAQ has support in the EMA ribbon, which also intersects with the white support zone and yellow support line. This yellow support line has been acting as a support level since January 2023. I think the NASDAQ will have a bullish Q4 and will trend towards a new all-time high (green circle). However, I think this new all-time high could get delayed until Q1 and Q2 of next year, but I do expect a strong performance for the NASDAQ in Q4.

$SQQQ Quarter 3 (Q3) AnalysisI also believe that SQQQ will form a new all-time low below $16.92 in Q4. Currently SQQQ is sitting directly below a resistance zone between $20.90 and $21.74, and the EMA ribbon is acting as an area of resistance. For bears that are long on SQQQ, the yellow resistance zone is a key price target and the next key price target on the way up is $29.19.

$QQQ Quarter 3 (Q3) AnalysisQQQ lost a support level during the last week of Q3. The last time this happened QQQ climbed up to a new all-time high in 2021 (shown by the yellow arrows). I believe the NASDAQ and its leverage-related ETFs are trending up to a new all-time high over the next few months (marked by the green circle). However, there was a special rebalance that occurred in July that is designed to slow the NASDAQ’s growth since the NASDAQ has been very strong this year. We still haven’t observed this effect yet since the stock market has been in a correction since the rebalance, but I’d imagine it will lead to a slower growth.

Nasdaq Trading IdeaBased on Simple Technical Analysis ( Trendline + Support & Resistance )
Risk Disclaimer:
Please be advised that I am not telling anyone how to spend or invest their money. Take all of my analysis as my own opinion, as entertainment, and at your own risk. I assume no responsibility or liability for any errors or omissions in the content of this page, and they are for educational purposes only. Any action you take on the information in these analysis is strictly at your own risk. There is a very high degree of risk involved in trading. Past results are not indicative of future returns. Good luck :-)

SPX | Don't fall for the trap...SPX is plowing through higher highs. It is a runaway train.
Have you entered that train yet? You better enter it because SPX will soar!
But runaway trains have the fate of collapsing in on themselves.
Their weight is too much for the foundation to sustain.
Not all is SPX. VIX is also attempting to measure the risk involved in SPX.
And VIX is as bullish as it gets.
But not all is VIX.
It is important to analyze the volatility of volatility. We are really entering inception levels here.
Volatility is too low and too stable . It is as if it is pressured to make all-time-lows. With such a low VVIX reading, we can conclude that VIX is having no second thought on dropping even further.
Curiously, the VVIX/VIX ratio is a neat SPX tracker.
I have posted about it ages ago.
So what can we conclude about volatility?
Historically, similar volatility traps have lead to severe crashes in the stock market.
Will this time be any different?
So what is in for the future?
Perhaps an all-time high for SPX will come first.
It is not that far...
Then, perhaps some SPX divergence against VVIX/VIX. SPX to move higher with VVIX/VIX moving lower. And then darkness.
Tread lightly, for this is hallowed ground.
-Father Grigori

NASDAQ Triple buy signal on the short term.Nasdaq hit yesterday the Falling Support of the Falling Wedge pattern as well as the Rising Support and is posting today the 2nd straight green (1d) candle.
At the same time, the RSI (1d) formed a Double Bottom.
Trading Plan:
1. Buy on the current market price.
Targets:
1. 15300 (Falling Resistance and 0.786 Fib).
Tips:
1. The RSI (1d) is under a Falling Resistance. If crossed over we may start having a case for resuming the bullish trend.
Please like, follow and comment!!

NASDAQ Correction LevelWe've been seeing NASDAQ index volume decline since mid-July. The rise slowed down and even came to a halt. Therefore, we expect a decline for NASDAQ in the coming period. This decline will reach the 200-day moving average of $14250. But the weekly close could be above $14550 in any case. At this level, purchases of US stocks can be considered.

NASDAQ NQ (QQQ, NDX) Gap Fill LongQuick take here before signing off. We’re already seeing a buy side reaction in US equity indexes as the ES (S&P 500) came very close to filling its downside futures gap. We captured the S&P 500 idea in a post several hours ago (). If equities retest lower, which we believe they’re likely to, the NQ has a couple solid demand/buy zones (green lines) not too far away. Per usual, we’ll have to see how prices approach the levels – hopefully we don’t get too much of a methodical grind lower, forming clean supply/resistance to immediately challenge buyers @ our demand areas; if this happens, the trade’s profit margin/risk-reward could be truncated.
We’ll do a more thorough check later and will update this post, but wanted to give you all something to think about. Comments welcome!
Jon @ LionHart Trading
