Short SofiNot sure what this company does. Candle pattern may form into something great, preempting that. RSI crazy, 50% allocation for this trade. Tight stops.
NASDAQ 100 CFD

NASDAQ The weekly charts tells you what you need to knowNasdaq / US100 is approaching today Resistance A (15280), which is the High of March 2022.
The pace of the rally since the start of the year has been so strong, in fact since the week of April 24th the index has posted only green weekly candles (8 today), that the 1week RSI reached a level (76.75) it last hit almost 2 years ago (on August 24th 2020).
In the last 6 years, every time the 1week RSI hit that level, Nasdaq made a top and corrected either immediately or in a few weeks.
On all those times, there was a clear Support Zone for the RSI to place your buys (47.90 - 52.90).
Also on all cases the price corrected to at least the 1day MA50.
This isn't primarily an invitation to sell what is obviously a bullish trend but rather take some profit of the index (or shares) in order to lay off some risk and enter again at a better price as suggested by the 1week RSI and the 1day MA50.
Our long term target is the 16840 All Time High (Resistance B) by December.
Previous chart:
Follow us, like the idea and leave a comment below!!

NQ big resistance. Reversal. FED. Market Euphoria.Started building a swing position with puts and margin. Will be actively managing it. Looking for approx 20% drop from here.
Markets euphoric, greed, AI mania.
FED clearly signaling more hikes.
Markets digesting news on a big resistance level. Trend reversal imminent.
Will look to scale out on a few daily consecutive closes above red box.
Enjoy.

$RSP performing better than $SPY, like we caleldAMEX:RSP = equal weight SP:SPX
We see that volume has been very good
AMEX:SPY is underperforming it & that is a good sign
NASDAQ:NDX underperforming as well
This means money is moving around & every one gets a chance to play
AMEX:IWM TVC:RUT has legs, call that it would break out was good
It also had great volume a few days ago
IMO #Stocks have what it takes to keep moving

NASDAQ: Approaching the March 2022 High on Fed week.Nasdaq is having an enormous rally since last December and the Double Bottom, with even the 1W time frame turning massively overbought (RSI = 74.522, MACD = 645.290, ADX = 53.716). The Double Bottom was formed on the Zone of the All Time High before the COVID crash. The market has filled a massive gap and this is why it has been rising so aggressively since the start of the year. History has shown that overbought levels can extend rallies for a short while before pull backs.
The Resistance ahead of us is R1 (15,280) and the Fed Rate Decision on Wednesday will be critical for the trend of the next 4-5 weeks. A closing above it can target the ATH regardless of the massively overbought technicals. A rejection can start a medium term decline near the Demand Zone. That would be the new entry point for long term investors.
## If you like our free content follow our profile to get more daily ideas. ##
## Comments and likes are greatly appreciated. ##

Japan Inflation Ni225 | JPYUSD problematic situation unfolding
Seeing major problems unfolding in Japan right now due to the QE of Japanese Government Bonds.
This is almost like a repeat of 1980-1990s Japan's M3 has gone exponential to the point some of this Yen is causing local inflation to rise.
When Japan was forced to raise rates due to the Ni225 creating unwanted inflation Japan's equity market imploded and the rush to Japanese YEN commenced.
This caused the Japanese YEN strength against the US Dollar to to climb flooding purchasing power back into the US equity markets contributing to sending the Dow 478%.
Talk about a problematic situation if Japan's Inflation bubble gets too big in Japan its going to send them back to the 80s.
We are at the start of a few G7 countries losing control of their entire financial system that leads to Hyperinflation.
225% Government debt to gdp is never scary, well until inflation starts to rise and you now need to deal with it.

NASDAQ Can cross above 2 Channels and reach 15100 now.Nasdaq has been trading inside two Channel Up patterns, one on the medium and one on the long term, which we've outlined in all recent ideas.
The current bullish wave has identical measures with those of the 2nd part of March and 2nd part of January.
It is highly probable with the current buying momentum to seek and complete this impulse and break over both Channel Up patterns.
Trading Plan:
1. Buy on the current market price.
Targets:
1. 15100 (Fibonacci 1.618 level).
Tips:
1. The RSI (1d) has formed a Double Top on a clear 76.55 Resistance. If it reaches that level before the price hits 15100, close the trade on whatever profit you have made.
Please like, follow and comment!!
Notes:
Past trading plan:

SPX Weekly Outlook: Week ending Jun 16We have monthly OpEx this week and futures contract rollover. Options are pointing to a move down to 4250 on SPX first and then based on CPI and PPI, a potential dump to 4150 or a ramp to 4400.
Expect a 125pt move from 4300 above/below. Flip point would be 4290-4310 , can treat that as no mans land.

NDX - Rising Trend Channel [MID TERM]🔹NDX shows strong development within a rising trend channel in the long term.
🔹NDX has risen strongly since the positive signal from the DOUBLE BOTTOM formation at the break through resistance at 12042.
🔹NDX has support at 13000 and resistance at 16500.
🔹Overall assessed as technically positive for the long term.
Chart Pattern;
🔹DT - Double Top | BEARISH | 🔴
🔹DB - Double Bottom | BULLISH | 🟢
🔹HNS - Head & Shoulder | BEARISH | 🔴
🔹REC - Rectangle | 🔵
🔹iHNS - inverse head & Shoulder | BULLISH | 🟢
Verify it first and believe later.
WavePoint ❤️

$NDX @ major resistance, $DJI & $SPX tooNASDAQ:NDX is having a TOUGH time here
The RSI collapsed
Not crazy about 4Hr action atm
CBOE:SPX & DJ:DJI are also struggling bit here but don't look as bad as the #NDXdoes
Small resistance in this area, pause time?
#stocks

NASDAQ: Bullish as long as the 4H MA100 holds.Nasdaq is having a standard technical pull back turning the 4H time frame neutral (RSI = 52.452, MACD = -2.890, ADX = 30.912) but the 1D remains bullish as since March 13th, the index has been trading inside a Channel Up pattern.
As the chart shows, every crossing under the 4H MA50 has been a buy signal (2 times) unless when the 4H MA100 broke as well, in which case the downtrend was extended to the 4H MA200 (2 times also). The 4H RSI has a clear Buy Zone and it just bounced on it, so we're already bullish (TP = 14,950). If though the 4H MA100 breaks, we will open a short term sell as well, targeting the bottom of the Channel Up (TP = 14,000), where upon contact with the 4H MA200 we will add a 2nd buy.
Prior idea:
## If you like our free content follow our profile to get more daily ideas. ##
## Comments and likes are greatly appreciated. ##

META Stock Price ActionThe bears have taken out the bulls recently, Meta stock might continue to fall using the FVG price action strategy, the next liquidity level seems to be near the 255 area. Banks are long META, long term seems bullish still on monthly chart.

$RSP & $RUT show money is in rotationAMEX:RSP looks okay to me (Equal weight SP:SPX )
TVC:RUT / AMEX:IWM also looks okay
Question:
What is the common theme?
HEAVY VOLUME!!!
Buys are heavier than normal for those 2 indices and NASDAQ:NDX / NASDAQ:QQQ has selling that's lil heavier than normal
Looks like rotation IMO
Our calls were on the money again...
#stocks

NASDAQ starting a short term correction.Nasdaq got rejected near the top of the 6 month Channel Up.
The narrower Channel Up however made an exact Higher High and the rejection today is a natural technical consequence.
This is most likely starting the 3rd correction wave.
Each wave has been less aggressive than the previous.
The breaking under the 4hour MA50 is the sell confirmation. Target the bottom of the short term Channel Up and the 4hour MA200.
Buy on the 4hour MA200 and target 15280 (Resistance A, High of March 29th 2022).
Previous chart:
Follow us, like the idea and leave a comment below!!

$RSP & $RUT performing well, money moving to underperformers Breadth has gotten better compared to last week
AMEX:RSP vs AMEX:SPY - Equal weight has outperformed
TVC:RUT Russell 2k pumping as well, our call on break looking good
NASDAQ:NDX looks to have short term topped - most flyers here
DJ:DJI hanging on - underperforming assets could be prepping to move
💵 could be moving from high flyers, it seems

NASDAQ RESPECTING H&S?NASDAQ Has formed a beautiful H&S pattern - yesterday we maximised the buy positions on the base, with rejection at the S Resistance we can possibly see the pattern playout - I would like a retest on the S resistance before taking shorts and then selling down to the base and then the main target at 14416.
If price breaks S resistance then we can see Nasdaq Matching the head and potentially move over to our main POI bing 14704.

Is the lagging S&P500 a better buy option than Nasdaq?Nasdaq's (NDX) incredible run (left chart) since the start of the year (+37%) has seen the index break above the Last Lower High of the Bear Cycle (13730) while at the same time avoiding a Death Cross on the 1W time-frame in epic fashion. It even broke above the RSI Resistance of the price's ATH (when the index was on its All Time High).
At the same time, the S&P500 (SPX) is obviously lagging behind (right chart) as not only the RSI is below its ATH Resistance but the index itself is only now approaching the Last Lower High of the Bear Cycle.
The question is, can the S&P500 be a better buy opportunity than Nasdaq since it is underperforming. Well being overperforming doesn't necessarily mean that Nasdaq is overvalued. Investors clearly thought at the start of the year that the technology sector would fuel the economy out of the 2022 inflationary Bear Cycle. However, it is also clear that the S&P has three target ahead of it (Last Lower High, First Lower High of Bear Cycle and the ATH), while Nasdaq two. In % terms, a ATH hit for the S&P500 from the current level would be a +12% rise, while for Nasdaq a 14.50% rise. Not that big of a difference on long-term terms and that has a lot to do with the fact that Nasdaq declined more that -37% during the 2022 Bear Cycle, while the S&P500 -27%. As a result, any buy between the two would be justified, even though a good pull-back on NDX would be more appealing to buy and couldn't be overlooked.
-------------------------------------------------------------------------------
** Please LIKE 👍, FOLLOW ✅, SHARE 🙌 and COMMENT ✍ if you enjoy this idea! Also share your ideas and charts in the comments section below! **
-------------------------------------------------------------------------------
💸💸💸💸💸💸
👇 👇 👇 👇 👇 👇

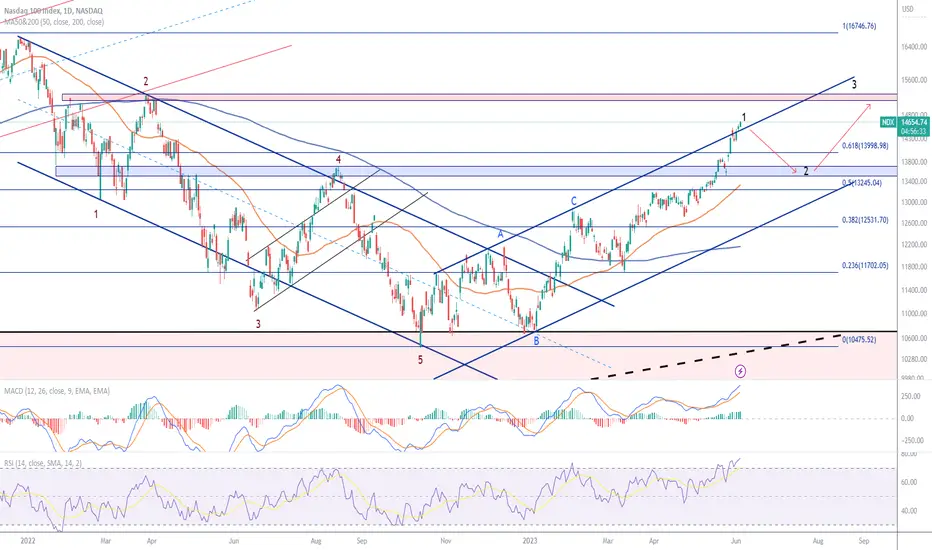
NDX possible 5-wave impulseSimilar to my SPX idea, the NDX seems to be forming a 5-wave impulse off the back of the AI enthusiasm. I expect a bullish pullback to pull the index lower towards the 61.8% Fibonacci retracement level of $14,000 which will flip from a resistance to a support. A break below $14,000 will allow the index to slide into the support range between $13,500 and $13,700. A break below the 50-day MA currently at $13,330 will invalidate the 5-wave impulse.
In terms of technical indicators, the daily RSI is heavily overbought which supports the notion of a pullback towards the support range. The daily MACD is holding a strong buy signal, but it is showing signs of rolling over.
NDX fantastic short opportunityI have to admit, most, if not all, Elliott Wavers were shot in the head this year with the rising market. Personally, I was caught off guard by the strong upmove too. For any EW and macro speculator, the upmove in 2023 don't make sense. It is irrational. In fact, it could be irrational exuberance again. But as time passes, the truth starts to unfold: the market capitalisation weighted indices were really being upheld by a few names. The rest were really flat or down. What this means is that the market breadth is not there for this rally. And this is something that is peculiar to this market because of the high market cap of a handful of companies. I don't think the original creator of the index thought that this could happen, but it did.
Nevertheless, I would admit that this is really another bold attempt to call a market top (or really, a correction top).
Disregarding EW technique which is either hated or loved, just look at the risk-reward for this trade. It doesn't make sense to go long, if this is the only rationale a trader needs to decide which side to trade on.
Good luck!

nasdaq updateI was really waiting for the market to go from the minimum numbers to the correction of the E wave, but this wave has reached its maximum numbers, which shows that the next correction wave is more time-consuming, but there is great power in the next upward wave.
I think this week we will see maximum numbers in the index and there is at least 3 months of correction ahead. Although there is a high probability this will be
Continue until the end of 2023

Nasdaq -> What A Short SqueezeHello Traders,
welcome to this free and educational multi-timeframe technical analysis.
On the weekly timeframe you can see that over the past couple of weeks, the Nasdaq had an insane rally towards the upside of roughly 25% and is now approaching weekly resistance.
Considering the fact that the overall trend is still very bullish I just do expect a short term rejection away from the $14.800 resistance area and then I definitely do expect the continuation of the bullrun.
On the daily timeframe you can see that market structure is still very bullish, there is still no sign of the Nasdaq slowing down yet, so there could be the possibility that we will see more continuation towards the upside to then retest the next major previous daily resistance at the $15.200 level before we will then see a short term drop.
Thank you for watching and I will see you tomorrow!
You can also check out my previous analysis of this asset:

NASDAQ One last bullish leg possible before exhaustion.Nasdaq (NDX) easily hit the 14350 Target that we called on our last analysis (see chart below) 10 days ago:
The price even broke above the 0.618 Fibonacci retracement level from the All Time Highs and hit the top of the March 13 Channel Up. However there is still some room left before hitting the top of the long-term Channel Up that started after the January 06 market bottom.
A pattern that supports this argument is the 1D RSI that is trading on Higher Highs similar to January 26 2023 and August 03 2022. Those was the last phase before the final Higher High that exhausted the trend and started a correction. As a result we will pursue one final upside target at 15000 and then most likely we will see a pull-back towards the 1D MA50 (blue trend-line).
-------------------------------------------------------------------------------
** Please LIKE 👍, FOLLOW ✅, SHARE 🙌 and COMMENT ✍ if you enjoy this idea! Also share your ideas and charts in the comments section below! **
-------------------------------------------------------------------------------
💸💸💸💸💸💸
👇 👇 👇 👇 👇 👇

$DJI leading, 1st time in long time, What about breadth? $RSPIs value coming back into play in the #stockmarket?
The NASDAQ:NDX does seem a lil over extended
Today is the1st day in LONG TIME that the DJ:DJI is leading and the RSI looks healthy
SP:SPX is over the 50% Fibonacci
AMEX:RSP (Equal weight #SPX) has chance to perform here
Let's see if the breadth of #stocks gets better
