Gold Market Update: Bears will target 3150 USD🏆 Gold Market Mid-Term Update
📉 Gold Drops: Prices dip as risk appetite grows and profit-taking kicks in.
🤝 U.S.-China Deal: 90-day tariff pause boosts USD, pressures gold.
📊 Tech Watch: Key support levels eyed by traders for entry points.
🔮 EUROTLX:4K Forecast?: Analysts still see path to $4,000 amid uncertainty.
⚠️ Recession Signal: Oil-gold gap hints at slowdown—bullish for gold.
🏠 Investment Shift: Gold now 2nd-best long-term U.S. investment (after real estate).
🌍 BRICS Buying: Emerging nations hoard gold to ditch dollar.
🛡️ $3,200 Holds: Gold maintains key support despite volatility.
📈 JP Morgan Bullish: EUROTLX:4K gold possible even with growth.
💰 Live Price: Gold at $3,253.40 (+0.52%) today.
📊 Technical Outlook Update
🏆 Bull Market Overview
▪️pullback in progress still
▪️3300 USD cleared by the BEARS
▪️market gapped down at open
▪️3300 is heavy resistance for now
▪️Compression on lower timeframes
▪️Flag on Flag Bearish pattern
▪️short-term expecting more losses
⭐️Recommended strategy
▪️Short Sell Rips/Rallies
▪️TP Bears 3150 USD
NASDAQ 100 CFD

When to buy Crypto and when to sell The only measure I've found that seems to have some consistency to assign relative value to crypto is by comparing BTC futures performance VS Nasdaq Total Return...
When BTC futures are in deep discounts it is time to Buy, when in wide premiums, it is time to sell!
Right now it's time to sell!

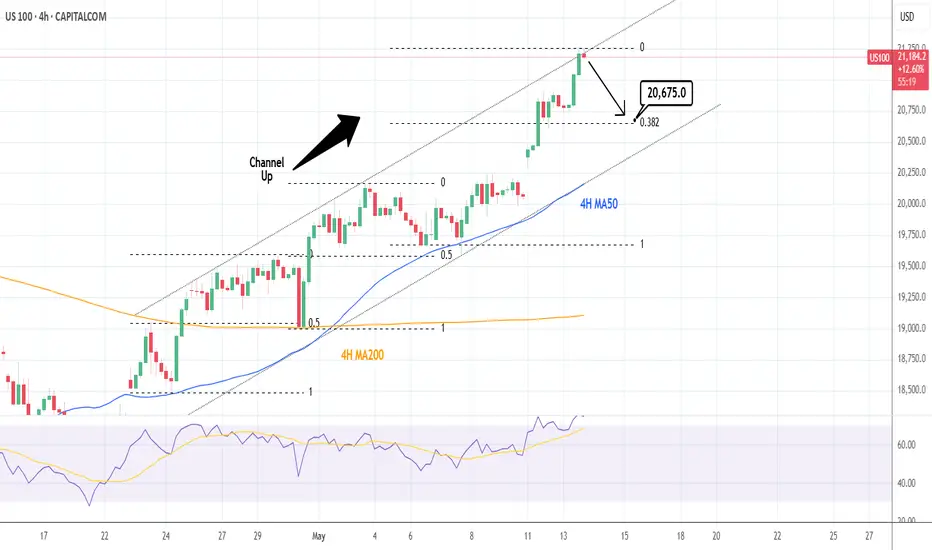
NASDAQ: Time for a 4H technical correction.Nasdaq is almost overbought on its 1D technical outlook (RSI = 69.775, MACD = 371.830, ADX = 37.524) and has reached the top of its 4H Channel Up. The two HH that the pattern has both pulled back to the 0.5 Fibonacci retracement level before the 4H MA50 provided the necessary support for the next bullish wave. Consequently we expect a small correction to at least the 0.382 Fib next (TP = 20,675).
See how our prior idea has worked out:
## If you like our free content follow our profile to get more daily ideas. ##
## Comments and likes are greatly appreciated. ##
We Have a Full Pattern into The Target BoxI am now looking for a 5-wave pattern to develop to the downside, followed by a 3-wave retrace, that in the coming weeks can take us back out of the Target box to the downside. Price must breach the 5578 area to give us any indication the pattern to the upside below is cracking.

NASDAQ broke above its 1D MA200 after 2 months! Target 22000.Nasdaq (NDX) broke today above its 1D MA200 (orange trend-line) for the first time in more than 2 months (since March 06), following the U.S. - Chine trade deal. This trend-line also had the March 26 rejection under its belt, which initiated the most aggressive part of the 'Trade War' correction.
The last time the index broke above its 1D MA200 on a similar pattern was when it was recovering after the bottom of the 2022 Inflation Crisis. The February 01 2023 break-out produced an instant rise to the 1.382 Fibonacci extension before a short-term correction to re-test the 1D MA200.
As a result, we expect 22000 (1.382 Fib ext) to come as early as this week before any discussions can be made for a new pull-back.
-------------------------------------------------------------------------------
** Please LIKE 👍, FOLLOW ✅, SHARE 🙌 and COMMENT ✍ if you enjoy this idea! Also share your ideas and charts in the comments section below! This is best way to keep it relevant, support us, keep the content here free and allow the idea to reach as many people as possible. **
-------------------------------------------------------------------------------
Disclosure: I am part of Trade Nation's Influencer program and receive a monthly fee for using their TradingView charts in my analysis.
💸💸💸💸💸💸
👇 👇 👇 👇 👇 👇

SPY WEEKLY 12 MAY 2025Welcome to Spy weekly. I have tried my best to explain the price action here. If you have any doubts, feel free to leave a comment or DM me.
NOTESTAY AWAY FROM OPTIONS

QQQ Don't Get Honey Dicked!These moves are designed to provoke emotions. Don't get fooled! Nothing has changed! Tariffs are not the problem; they are only a symptom of it.
Click BOOST, Follow, Subscribe!
Let me help you navigate these crazy markets.

NASDAQ (NDX) Market OutlookCurrently, the NASDAQ is trading around 19,723. We're anticipating a short-term pullback toward the 19,462 level, where a significant pool of liquidity awaits. This zone could act as a magnet for price in the near term. Once price reaches this area, we’ll closely monitor the lower timeframes for a potential bullish reaction or accumulation, which could signal the next leg higher.
Stay patient and let price confirm at key levels.

NASDAQ: Rebounding on the 4H MA50. New High for the Channel Up.Nasdaq is marginally bullish on its 1D technical outlook (RSI = 56.883, MACD = 127.320, ADX = 37.197) and is rebounding today on the 4H MA50, right before the HL of the Channel Up. This is a technical bottom that calls for a buy. We aim for a new +6% bullish wave (TP = 20,800).
## If you like our free content follow our profile to get more daily ideas. ##
## Comments and likes are greatly appreciated. ##

$DJI & $NDX at MAJOR RESISTANCEDaily
The TVC:DJI has done well since April & we noticed a sentiment change. This is why we turned bullish. Only problem? Lack of volume. We can see that volume stayed under the pink dots. This is an average of 90 days.
We can also see this by the Money Flow. As of now the lowest peak since mid March on this indicator.
---
Weekly
The TVC:DJI RSI hasn't broken the halfway point. This is needed for more bullish momentum.
Money flow is slanting lower. The interesting tid bit is that volume for the week is not bad at all. But compare this to Jan 2024 and 4th quarter of the same year... LOWER.
Posted this yesterday, see profile for more info.

NASDAQ's Inverse H&S that targets $25000Nasdaq (NDX) is forming the Right Shoulder of a potential Inverse Head and Shoulders (IH&S) pattern. The price action is 'stuck' within the 1D MA200 (orange trend-line), which got tested on Friday for the first time since March, and the 1D MA50 (blue trend-line).
Since the 1D MA200 was the level that initiated the March 26 rejection, it is possible to see a short-term pull-back now, all in the process of forming the Right Shoulder and after the market digests the new Fed Rate Decision, starts the next Leg Up. Note that the 1D RSI is already on its February highs.
As a result, our long-term Target is at 25000, just below the 2.0 Fibonacci extension level, which is a standard technical target for IH&S patterns.
-------------------------------------------------------------------------------
** Please LIKE 👍, FOLLOW ✅, SHARE 🙌 and COMMENT ✍ if you enjoy this idea! Also share your ideas and charts in the comments section below! This is best way to keep it relevant, support us, keep the content here free and allow the idea to reach as many people as possible. **
-------------------------------------------------------------------------------
Disclosure: I am part of Trade Nation's Influencer program and receive a monthly fee for using their TradingView charts in my analysis.
💸💸💸💸💸💸
👇 👇 👇 👇 👇 👇

PZZA'S 3ed Highest ever 21 Week volume's Average !People are buying no question is aske !!!
The real question is whether we have bottomed or not !!!
Fact: This is a trough in the "Making" !!!

NASDAQ: 50% probability that this Golden Cross is bearish.Nasdaq is bullish on its 1D technical outlook (RSI = 60.920, MACD = 61.810, ADX = 33.031) as it continues its recovery from the Low of the previous month. In the meantime, it formed a 4H Golden Cross, the first since January 23rd. Even though this is a bullish pattern theoretically, it often doesn't deliver an immediate rise. More specifically, since the October 2022 market bottom, Nasdaq has had another 10 Golden Crosses on the 4H timeframe. The interesting statistic is that 5 have extended their rallies but the other 5 cuased a pullback (short or medium term). Consequently we call for caution in the next 2 weeks, as the market may correct towards the 4H MA200 before it resumes the long term uptrend.
## If you like our free content follow our profile to get more daily ideas. ##
## Comments and likes are greatly appreciated. ##

PZZA, a chart to be remembered !2ed Highest short sell volume since 2018 with lower low happing after it !!!
Could be nothing right, or it could be everything !!!

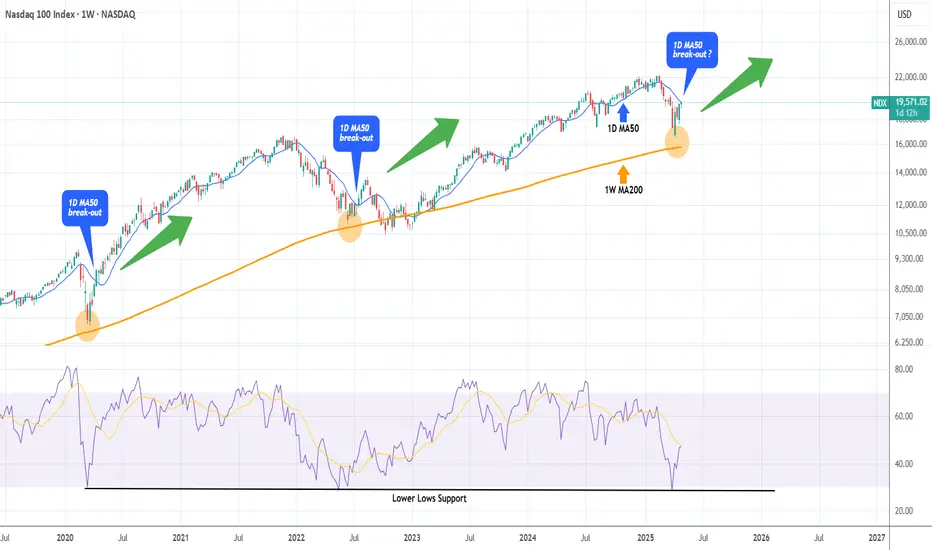
NASDAQ testing its 1D MA50. Break-out or Fake-out?Nasdaq (NDX) has reached its 1D MA50 (blue trend-line) for the first time since February 24. Following the (near) rebound on the 1W MA200 (orange trend-line), this looks like a textbook recovery from a correction to a new long-term Bullish Leg.
Chronologically the last such correction was the March 2020 COVID flash crash, which after it almost touched the 1W MA200, it recovered as fast as the current rebound and when it broke above its 1D MA50, it turned it into the Support of the new long-term Bullish Leg.
What wasn't a break-out but a fake-out was the rebound after the June 13 2022 (near) 1W MA200 rebound, when the break above the 1D MA50 was false as it produced a new rejection and sell-off later on. The difference is that 2022 was a technical Bear Cycle both in terms of length and strength.
Whatever the case, Nasdaq has seen the lowest 1W RSI (oversold) reading among those 3 bottoms. So do you think today's 1D MA50 test is a break-out or fake-out?
-------------------------------------------------------------------------------
** Please LIKE 👍, FOLLOW ✅, SHARE 🙌 and COMMENT ✍ if you enjoy this idea! Also share your ideas and charts in the comments section below! This is best way to keep it relevant, support us, keep the content here free and allow the idea to reach as many people as possible. **
-------------------------------------------------------------------------------
💸💸💸💸💸💸
👇 👇 👇 👇 👇 👇
NASDAQ: Rejected on the 1D MA50. Can it break it?Nasdaq is neutral on its 1D technical outlook (RSI = 52.608, MACD = -100.810, ADX = 23.609) as it got rejected today on the 1D MA50. That is the first serious Resistance test of the April 7th rebound and until it breaks, we can see a technical pullback to the 4H MA100 in order to establish the new Support. With the 1D RSI confirmed the new long term bottom with a DB, buying the dips on every such pullback is the most effective strategy on such occasions. Our short term target is the R1 level (TP = 20,300).
## If you like our free content follow our profile to get more daily ideas. ##
## Comments and likes are greatly appreciated. ##

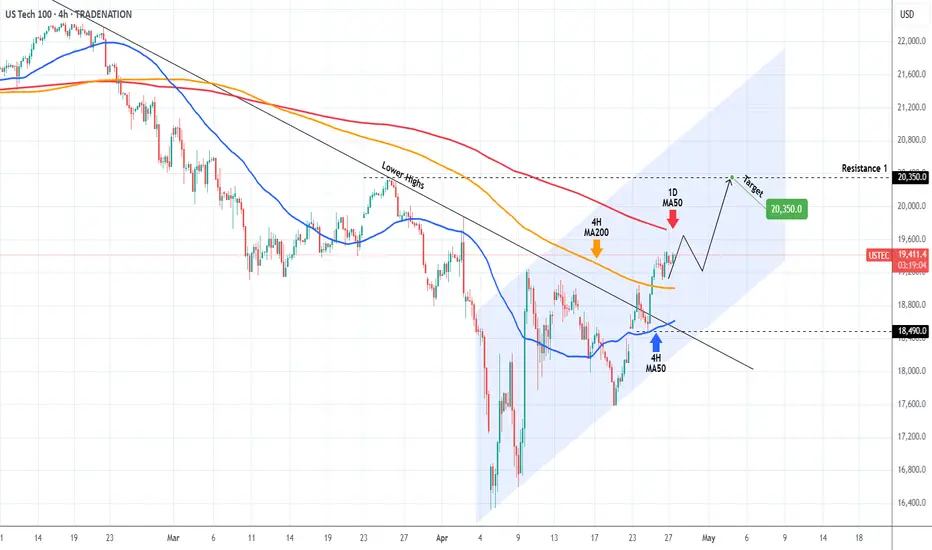
NASDAQ ahead of the most critical Resistance test.Nasdaq (NDX) not only broke above the Lower Highs trend-line of its All Time High (ATH) last week but managed to break and turn the 4H MA200 (orange trend-line) into Support.
It is now aiming for the 1D MA50 (red trend-line), which is the most crucial Resistance level of this recovery attempt and is what technically turns bearish trends into bullish if it turns into Support.
We expect a short-term rejection there, which should give a buy opportunity near the 4H MA200. Our Target for this is 20350 (Resistance 1).
-------------------------------------------------------------------------------
** Please LIKE 👍, FOLLOW ✅, SHARE 🙌 and COMMENT ✍ if you enjoy this idea! Also share your ideas and charts in the comments section below! This is best way to keep it relevant, support us, keep the content here free and allow the idea to reach as many people as possible. **
-------------------------------------------------------------------------------
Disclosure: I am part of Trade Nation's Influencer program and receive a monthly fee for using their TradingView charts in my analysis.
💸💸💸💸💸💸
👇 👇 👇 👇 👇 👇
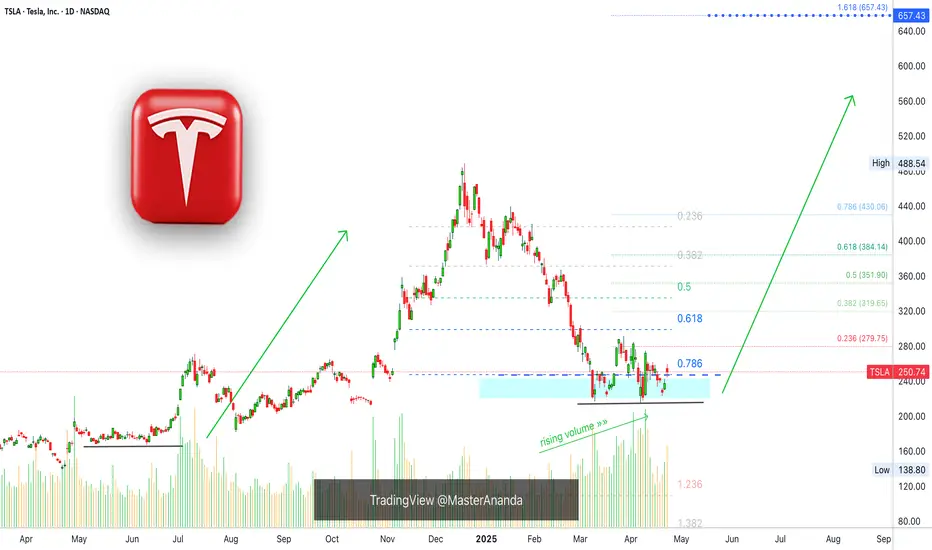
Tesla Finds Support, 657 Next Easy High & All-Time HighTesla is looking pretty good right now, support has been found. The correction amounted to -55.5%. It started in mid December 2024 and the first low was hit in March 2025.
Since March TSLA has been in the process of forming a bottom.
The action moved below 0.786 Fib. retracement level in relation to the last bullish wave. The action is back above this level now and this is pretty good. As long as the action happens above the magic blue dashed line, Tesla is good and set to grow.
This signal, perfect symmetry, is supported by rising volume.
Buy volume is rising massively as TSLA moves into a long-term support zone.
(Smart people, smart money and smart traders buy when prices are low —this volume signal reveals the highest buying in years as TSLA hits support.)
The most revealing fact from a logical standpoint is the size of the correction, a 55% correction is a lot by any standard. When a market goes through such a strong correction, it tends to reverse and produce next a new move. It moves in waves. It goes up and down, up and down. We are seeing the end of the down-move and this will automatically lead to an up-wave.
When the bottom was hit, last month, the action goes flat. Tesla was clearly moving lower but as support was found the bottom stays flat. This is another revealing signal for the logical mind. No longer a downtrend but a consolidation phase, which is part of a transition period.
» So the market was bullish and from bullish turned bearish, from bearish it went sideways and from sideways it will grow.
This is an easy buy.
Thanks a lot for your comment and continued support.
Namaste.
Nasdaq market analysis: 23-APRIL-2025Good morning Dear Traders! Join me for Nasdaq market analysis for today. Share your charts, ask questions, and let's discuss trading strategies.

Global Supply Chains being Undone could be the cause of a (IV)I have been discussing the potential for a Super-Cycle wave (III) top in the US markets for the last couple years. To experience a wave (IV) of SUPERCYCLE PREPORTION, would be a consolidation of price action back to the 1929 stock market crash. The byproduct of this type of price action would be a decline of 50% or more (likely more) in the value of global stock markets. This type of asset price deflation would make anyone who watches the markets be inquisitive as to what would or even COULD cause such an event.
Would the dismantling of global supply chains, that have been in place since the early 1990’s, be the culprit?
I am starting to think the answer to that question is yes. This is not an indictment of the policy, but more an acknowledgement of the disruption and the possible aftermath.
The obvious concern is how do businesses plan? I would venture a guess business leaders will be challenged, and many may not survive. The cost equation becomes so skewed…how does one make money without passing the costs on to the consumer? That means higher inflation.
If this is the case, it’s possible digital assets become more of a safe haven which would be counter intuitive to hard asset value. This would mean that we will have endure a cycle of higher inflation, higher interest rates, and higher unemployment, coupled with lower economic growth. I cannot say this is how the forecasted price action is justified in the future. What I can say is the resulting price action will look very similar to the below.

NASDAQ Decision making becomes easy after seeing this chart.NASDAQ (NDX) is currently on the 3rd straight red month (1M candle), following the February High and subsequent sell-off due to the Trade War. This has been analyzed extensively in previous analyses and how the fundamental scene is only now starting to show some positive progress but still has a long way to go.
Technically though, the picture is very clear and favors long-term investing. The market has been trading within a Fibonacci Channel Up since the U.S. Housing Crisis in 2008 and along with the 2022 Inflation Crisis, those have been the only real Bear Cycle events in the past 18 years.
In between those there have been another 5 shorter term corrections, that offered great buying opportunities for the long-term and the recent 3-month one classifies as one.
There reasons are three. First it has come very close to the 1M MA50 (blue trend-line), which only broke during the Major Corrections. Second, the 1M RSI hit the 50.50 Symmetrical Support, which has held during all those 5 prior Minor Corrections. Third, those corrections only range between two Fibonacci levels.
The current correction fulfills all those conditions. And since the 'weakest' rally we've have on this 5 event sample has been +37.57% and the strongest +96.77%, we have a medium-term Target on Nasdaq at 22800 and a long-term one at 32500.
Do you still reserve doubts at investing long-term after seeing this macro chart?
-------------------------------------------------------------------------------
** Please LIKE 👍, FOLLOW ✅, SHARE 🙌 and COMMENT ✍ if you enjoy this idea! Also share your ideas and charts in the comments section below! This is best way to keep it relevant, support us, keep the content here free and allow the idea to reach as many people as possible. **
-------------------------------------------------------------------------------
💸💸💸💸💸💸
👇 👇 👇 👇 👇 👇

AAPL About to CRACK!Without Question, AAPL is the best company in the world and the most valuable. However, it means little in this economic landscape.
AAPL is about to start cracking here. I usually do not post them ahead like this, but in this situation, I will break my own rules.
Take your money and RUN!!!
WARNING!! GTFO!

A Tolled BellThe first bell has rung. A bridge is being paved across the $6000 range.
IF it blows up, it likely won't happen until the bridge is constructed and sentiment improves. Expect a few heartfelt endeavors to shoot above $6,660. Base case is long term crab market.
