Weekly Update: Is EVERYTHING about to come down together?Is a rare event when multiple planets are aligned in the night’s sky. It’s rarer still, when their aligned, and visible to the naked eye, and on-lookers do not require the use of a telescope.
Let me explain.
My crypto currency coverage list (SOL, ETH, BTC and ADA) have been rallying and hitting some of their initial sub-divided targets higher where I would soon expect them to retrace. Financials (XLF) could be completing a minor wave 4 high and now coming down in a wave 5. The SPX and the ES appears to have just completed their D-wave high in what I'm counting as a triangle and should be coming down as early as today. I suspect if I looked at some of the heavily weighted stocks of the SP500 they would show the same pattern and potential conclusion.
Is everything aligned?
The downside IN EVERYTHING appears clear enough, you don’t require a telescope to see that.
NASDAQ 100 CFD

Netflix dumps and pumps after earningsYesterday, after the market close, Netflix reported its earnings for the 1st quarter of 2023. The tech giant missed analysts’ expectations, resulting in a quick and sharp selloff of nearly 12%. However, this move lasted only three minutes before the price started reversing to the upside. Within the next hour, shares erased all of their early losses.
The company posted $1.305 billion in net income, showing a decline of 18.3% YoY (in 4Q22, Netflix reported a net income of only $55.284 million). Revenue stood at $8.161 billion, up approximately 3.7% YoY and 4% QoQ. Operating income fell by 13% YoY. In addition to that, the average paid memberships rose by 4% YoY, with the company reaching 232.50 million global streaming paid memberships.
In 1Q23, Netflix launched paid sharing in four countries, and in the second quarter of 2023, the company plans to expand this service into more countries, including the USA. Furthermore, Netflix seeks to improve its revenue from advertisements and currency operations. For 2Q23, Netflix forecasts revenue of $8.2 billion, representing a 3% increase YoY. The company also expects to return $1.6 billion in operating income for the same period. Netflix shares are up approximately 105% since their low in May 2022 and about 16.5% year-to-date.
Other important information
The company’s operating income declined for four consecutive months in 2022 - 1.972$ billion in 1Q22, 1.578$ billion in 2Q22, 1.533$ billion in 3Q22, and 550$ million in 4Q22. The same applies to the net income in 2022 - 1.597$ in 1Q22, 1.441$ billion in 2Q22, 1.398$ billion in 3Q22, and 55$ million in 4Q22. In the first quarter of 2023, Netflix saw a significant rebound in both of these metrics.
Illustration 1.01
Illustration 1.01 portrays the 1-minute chart of Netflix stock. The yellow arrow indicates market close, which coincided with the release of the company’s financial results. Within the first three minutes following the announcement, shares dropped nearly 12% before erasing all losses.
Illustration 1.02
Illustration 1.02 displays the daily chart of Netflix stock. Yellow arrows indicate previous earnings, which were accompanied by a similar negative reaction in the price of shares.
Please feel free to express your ideas and thoughts in the comment section.
DISCLAIMER: This analysis is not intended to encourage any buying or selling of any particular securities. Furthermore, it should not be a basis for taking any trade action by an individual investor. Therefore, your own due diligence is highly advised before entering a trade.

NASDAQ Today D1Here is my view for NASDAQ on D1. The price could go bullish, you can put a pending order on the Order block or find an entry on LTF within OB Zone. Trade Safe!

Nasdaq 100 showing HUGE upside with its Cup and Handle to 16,073Cup and Handle formed over the last couple of months.
A big one for that matter.
The price broke out of the brim level, but the price action has been very sloppy.
There is clearly a fight between the bulls and bears.
And so, that's why there's been a consolidation.
We can wait for the price to break above the small rectangle formation, before getting in to avoid a fakeout.
7>21>200
RSI>50 (Higher lows)
Target 16,073
SMC
Sell Side Liquidity (Order Block) is below the handle of the cup. Also the 200MA is around these levels which makes it another STRONG Level of liquidity for SM to buy.
The bias is very bullish, we just need the next push up.

Nasdaq -> This Is The SetupHello Traders,
welcome to this free and educational multi-timeframe technical analysis .
On the weekly timeframe you can see that nas100 just recently perfectly broke above, retested and already rejected a quite obvious weekly structure area exactly at the HKEX:12 ,000 area.
You can also see that we are approaching another weekly resistance area at the HKEX:13 ,200 level, you can also see that nas100 just had a pump of about 15% towards the upside over the past couple of weeks, so I simply do expect a short term correction back to the HKEX:12 ,800 area and then a next impulse towards the upside from there.
On the daily timeframe you can see that nas100 has been trading in a range over the past couple of days, I am also now just waiting for a deep retest of the next daily support zone at the HKEX:12 ,800 area and then there is a very high chance that we will also see more daily continuation towards the upside from there.
Thank you for watching and I will see you tomorrow!
You can also check out my previous analysis of this asset:

Major Recession on the Basis of Yield CurveThe US Treasury Yield Curve is currently inverted, meaning short term interest rates higher than long term interest rates.
This unusual occurrence, called a yield curve inversion, has historically been a very reliable indicator of an upcoming economic recession.
Since World War II every yield curve inversion has been followed by a recession in the following 6-18 months, and recessions are naturally correlated with decreased stock market returns.
The yield curve has not been this lowin over 40 years.
The yield curve indicator is always followed by a major drop.
Triggering of the yield curve indicator also (ALWAYS) lags the yield curve inversion.
In other words, the yield curve inversion must return positive before the indicator triggers.
This is due to the lagging effects of interests rates on the economy.
That being said, since the yield curve is currently severely low, we can expect (another) yield curve indicator to be triggered later.
Once it is triggered, I expect a long-term decline of the markets.
Based on historical data, the decline will last several months, if not years.
Best of luck (not financial advice).

NASDAQ Pullback to the Support, then buy for a new High.Nasdaq is consolidating around the MA50 (4h).
Every such consolidation that followed a High inside the Channel Up, pulled back to the Support of the last Higher Low.
Trading Plan:
1. Sell on the current market price.
2. Buy on the Support.
Targets:
1. 12520 (Support).
2. 13730 (Resistance 1).
Tips:
1. The MACD (4h) gives a buy signal when it crosses over the top of the Falling Wedge. It has happened on both previous patterns.
Please like, follow and comment!!

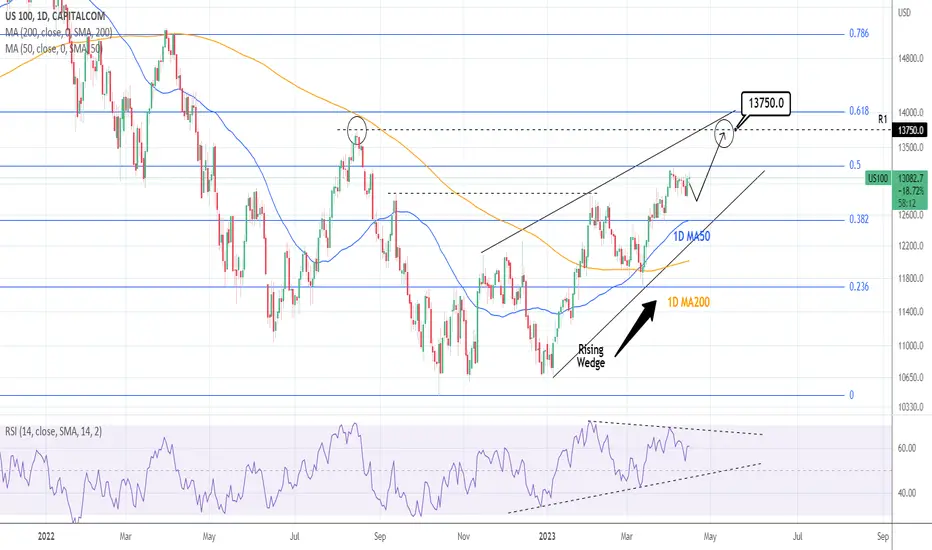
NASDAQ: Gap fill at 13,750 imminentNasdaq has completed a rather neutral week, after getting rejected on the 0.5 Fibonacci, accurately depicted on the mixed 1D technicals (RSI = 59.704, MACD = 168.310, ADX = 29.641). The Rising Wedge is leading the index towards the R1, the most important Gap Fill of August. As long as the 1D MA50 supports, we will stay bullish (TP = 13,750).
Prior idea:
## If you like our free content follow our profile to get more daily ideas. ##
## Comments and likes are greatly appreciated. ##
🥂CAC40: Croisière sur la Seine, avec une bouteille de ChampagneLuxury shares boost Europe's STOXX 600, French stock index TVC:CAC40 hit new record high.
European shares climbed on Thursday on a boost from luxury stocks after XETR:MOH posted upbeat first-quarter sales, while hopes of a pause in the Federal Reserve's rate hikes after signs of cooling U.S. inflation also aided sentiment.
👉 The pan-European STOXX 600 rose 0.4%, while the blue-chip index (STOXX50) gained 0.5%, inching closer to its highest level in 22 years hit on Wednesday.
👉 LVMH climbed 5.7%, closing at a record high after the world's largest luxury company reported a 17% jump in first-quarter sales that breezed past estimates as business in China rebounded sharply.
👉 European stocks have more than recouped last month's declines with gains of 1.4% so far, outperforming the benchmark SP:SPX index on Wall Street, amid ebbing fears of a steep recession in the euro zone.
👉 European stocks are seen as undervalued compared to their U.S. peers. With the economic outlook for the U.S. deteriorating, investors appear happier now to take advantage of this pricing skew and buy relatively cheaper European shares. The risk factor that had been associated with holding European shares is diminishing and this is allowing investment decisions to be made based more on fair value plays.
Technical pictures in France Stock Index TVC:CAC40 indicates the breakout of massive 20-year old Reversed Head & Shoulder structure, so it seems a lot of gain here is yet to come.🥂

NASDAQ More likely going lower but buy above this levelNasdaq is on a long term Channel Up but currently on a short term Channel Down.
If the latter continues to replicate the February Channel Down, Nasdaq can dip as low as 12400.
If the price crosses over the recent 13250 High, then the above is invalidated.
In both cases buy and target 14000.
Follow us, like the idea and leave a comment below!!

$VIX breaking a bit, showing Positive Divergence - Sold puts MayAs an FYI we're still cautious bull. We did initiate a CBOE:VIX position, by selling puts, as small hedge.
We've made clear what the targets on indices were, still think they can be hit.
TVC:DJI - 34250 - Major Resistance
NASDAQ:NDX - 13400 - Fib level
SP:SPX - Major resistance - 4181
But keep in mind;
IMF warning global debt levels = DANGEROUS
#Fed states > #recession coming

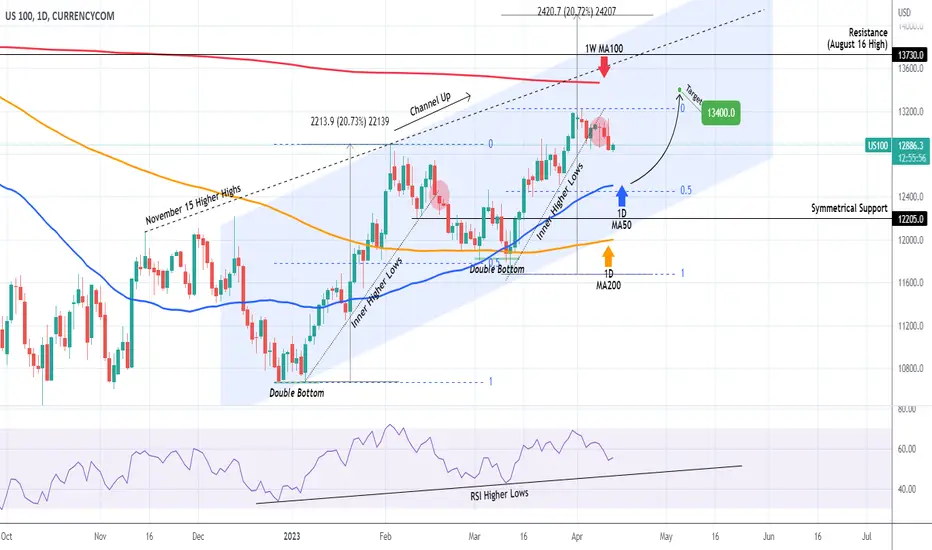
NASDAQ Correction for few days then buy the dipNasdaq (NDX) has gone a long way since we called for a rebound on the 1D MA200:
The recent rally within this Channel Up pattern that started in December (its second Bullish Wave), came to an end after it broke the Inner Higher Lows trend-line in similar fashion as the first wave did on February 17. That pulled-back to the 0.5 Fibonacci retracement level before rebounding to a Higher High.
The current 0.5 Fib is on 12460, a little under the March 28 Low and the 1D MA50 (blue trend-line), which has been basically supporting since mid-January. If the RSI bounces off its Higher Lows trend-line, then the bottom may come earlier. In any case, we will buy this pull-back and target 13400, a potential contact with the 1W MA100 (red trend-line), which rejected the August 16 High.
The best level to buy during this run is on the Higher Lows trend-line of the RSI. A similar Higher Lows trend-line during the January bullish leg (note that both sequences started on a Double Bottom), gave 5 clear buy entries.
-------------------------------------------------------------------------------
** Please LIKE 👍, FOLLOW ✅, SHARE 🙌 and COMMENT ✍ if you enjoy this idea! Also share your ideas and charts in the comments section below! **
-------------------------------------------------------------------------------
💸💸💸💸💸💸
👇 👇 👇 👇 👇 👇
#yields - $TNX at important juncture1Yr is still holding better than 2yr & 10Yr
IMO Still look like they're fighting to bottom, HOWEVER, TVC:TNX has a history of breaking current support level.
Monthly RSI looks 2b weakening.
While in theory falling #yield is good for #TECH it historically has NOT been good for #stocks

S&P 500- Still targeting 4300+Hello traders!
Many times in previous post we talked about a primary wave (B) to the upside to conclude above 4300 for the S&P.
We believe that we are currently going for wave 5 of C, as also the inverse head and shoulder suggests.
clearer picture on Nasdaq, where W pattern and descending broadenign wedge are targeting at least 13600 for this upside correction (end of double zig zag).
There we will re consider the possibility of a short, tracking the possible Wolfe Wave in the making.
For now, we opened a small long at the recent dip at 12909.1. Will update below!
Bests!
GMR

12042023 - $NDX #NDXNDX levels gave the highs yesterday and as mentioned for yesterday, said we should see a dip but would be bought up; but overall NDX is still looking weak. Unlike SPX, NDX is going below the 2 zones, which is more bearish.
For now, before CPI, 13114 and 12870 are fadable IMO, especially if we see 12870, would be a good level to go long back to the zone.

Huge Bullish Volume DivergenceThe magnitude of this divergence is enormous.
Other indictors are trending in the bullish direction
We should see a nice pop for SQQQ
