Nvidia: Bullish Monday?A new week is about to get started and we would like to know if the NVIDIA Corporation (NVDA) chart supports a bullish Monday.
What is the chart saying on the daily timeframe?
The chart has many positive signals and support a strong week but...
Good Sunday my fellow Cryptocurrency trader, how are you feeling in this wonderful day?
I hope you are doing great.
Let's read the chart; together, let's trade!
The chart looks really good and the short-term can always surprise, anything goes.
The chart is saying, "up, straight up," and even though the markets are unpredictable, I can easily tell you what the market is doing and is most likely to happen after the weekly close.
NVDA is super bullish and likely to continue growing based on multiple signals:
1) The falling wedge pattern is already confirmed. The action broke above it.
2) The trading volume supports a continuation of the pattern breakout.
3) The correction was really strong but the reaction to support was even stronger. Such a strong reaction indicates that traders were anxious and ready to buy. The only reason to sell was based on political bad news. With the bad news removed, up we go. NVDA is solid and with Bitcoin and mining growing, the market expanding, AI, NVDA is set to follow and also grow.
4) Both the 0.786 and 0.618 Fib. retracement levels are major support and gauge the strength of a stock. If the action is happening below, bearish; when the action happens above bullish. The fact that the action moved below just to recover makes this a strong bullish signal. A failed signal for the bears because they failed to move prices lower. A strong bullish signals for the bulls because the action is back above long-term critical support.
5) The session 10-April closed as a hammer and this also points up.
6) Finally, NVDA managed to close daily above EMA8, EMA13 and EMA21. Short-term bullish bias is now valid, active and confirmed.
All these are bullish signals saying that the market will move higher next.
What needs to happen for all this to become invalid?
NVDA would need to close daily below the last low.
No need to worry about short-term moves and noise. We are going up long-term.
The correction here reached more than 43%. Believe it or not, a 43% drop is a very strong drop. For the market to go lower, it would need to be the end of the company or worse. What need is there for a stock like this one, with a great product in huge demand, to drop by 80%, for what reason?
We are going up.
Namaste.
NASDAQ 100 CFD

Nasdaq analysis: 17-APRIL-2025Good morning, traders! Today's Nasdaq analysis will help you achieve your trading goals. Let's work together towards success.

Nasdaq insights: 16-APRIL-2025Good morning, traders! As a seasoned price action trader, I'll share my Nasdaq insights to help you improve your trading skills.

Daily Price Action: Nasdaq NDX Tuesday 4/15/2025In this video, we are looking into the potential daily price action of NDX.

Caution on Crypto, Tech, SPXI know its a mess, this is just for me anyway.
I tend to overcomplicate things so now then, lets over simplify for my monkey brain:
Trend line broken = Warning, thing are likely to change ( even though you didnt get the bull market you wanted)
Watch said trend retest, look for weakness, struggling price action
selling on the retest of the top lows last time would offer you 5% off the peako top, (Thats really good!! stop being a perfectionist)
I am very much frustrated with this market, never got the crazy part I was waiting for. But the lack of euphoria is really not that unreasonable when you think about what has been goin on the past 5 years. Everyone is poorer liquidity has been super tight to curb inflation and we still got NASDAQ:NDX up 150% Coinbase NASDAQ:COIN did a 10x and I still am not happy(likely due to the max pain trade of my life COINBASE:ETHUSD ). I have realized that I have been hoping for another 2018 bull run. It may or may not happen, but I can't expect any market to reflect that in any significant way. Markets are much more dynamic than I give them credit for sometimes. They will rhyme but often in ways you do not expect and will not be made clear until that little bastard hindsight kicks in, showing you how obvious it was.

Nasdaq analysis: 15-APRIL-2025Good morning, trading community! Today's Nasdaq analysis is for you. Share your thoughts, ask questions, and let me help you grow.

Price Action: Nasdaq NDX Monday 4/14/2025In this video, we will be looking at the Nasdaq (NDX) on the daily chart and its potential Movement throughout Monday 4/14/2025.

NASDAQ Trump's 2 TRADE WARS are identical! What you need to knowNASDAQ (NDX) had a massive bullish reversal 1W candle last week as, despite a Lower Low opening, the intra-week rebound surpassed the opening of the previous week. The sell-off reached almost as low as the 1W MA200 (orange trend-line) , which has been the Support level of the late 2022 Inflation Crisis bottom and has been untouched for more than 2 year.
This is not the first time we see this pattern. In an interesting twist of events, we saw the exact same formation during Trump's 1st Trade War, which bottomed on the week of December 24 2018, near the 1W MA200 as well and exactly on the 0.382 Fibonacci retracement level from the Top.
The similarities don't stop there as both Trade War periods were manifested within Megaphone patterns. Their sell-off/ Bearish Leg was -25% (now) and -23% (2018) respectively, while the set-up leading to those Megaphones was a +103.50% and +113.50% Bull Cycle respectively. Also both sell-offs got an oversold (30.00 or lower) 1W RSI bottom.
So, since NDX has currently completed a -25% correction near the 1W MA200 and the 0.382 Fib with the 1W RSI bouncing off the oversold barrier, it is very likely that we've formed the pattern's bottom, especially if the global fundamentals point towards trade deals.
If this Low remains intact, we expect a similar +35% short-term Top at 22500 within a 3-4 month period and then long-term rally near the -0.382 Fibonacci extension at 29000.
-------------------------------------------------------------------------------
** Please LIKE 👍, FOLLOW ✅, SHARE 🙌 and COMMENT ✍ if you enjoy this idea! Also share your ideas and charts in the comments section below! This is best way to keep it relevant, support us, keep the content here free and allow the idea to reach as many people as possible. **
-------------------------------------------------------------------------------
💸💸💸💸💸💸
👇 👇 👇 👇 👇 👇

Nasdaq market analysis: 14-APRIL-2025Good morning! Happy New Week! Here's your daily Nasdaq market analysis. Learn, grow, and trade wisely.

MARA Holdings, Inc.: Your Altcoin ChoiceThis is obviously not an Altcoin but it was requested in the Altcoin Choice session that we did recently, so here is the analysis.
MARA Holdings, Inc. (MARA) . It looks good.
A long-term higher low has been established. MARA produced a low first in October 2023. This was followed by a series of swings and waves. Reaching the later part of 2024, the action turned full bearish and now in April 2025 MARA Holdings seems to be ready to go bullish again. And here the stock printed a higher low.
A long-term higher low will lead to a long-term higher high. The last peak happened in February 2024 at 34.09. The next higher high at 42.86 is an easy one and should happen in 2025. It can definitely go higher but I am no stocks expert so can't dig any deeper for you.
In support of these signals, I looked for the RSI and found a small bullish divergence. It is only a month old but it is still a bullish divergence and it is valid. The reading on the RSI is also good and supports a new wave of growth. It seems Crypto and the stock market are now one.
Trading volume is standard and average and does not support our bullish bias, but it doesn't negate either. Average volume with no change on the upside or downside supports a neutral market. A market on autopilot. If there was a bearish move this bearish move is not strong as it is not supported by volume. So the early reversal signals can be good as there is nothing to hold the bearish wave. Things can change, but we are not talking about that, we are looking at the chart and what it currently says.
The chart is saying that MARA can start to grow in the coming weeks and days. If this growth develops, it can last months and end up in a new high, a higher high based on the long-term.
Thank you for reading and for your continued support.
Namaste.

GOLD Bull Market Price Target is 7 500 USD accumulate on dips🏆 Gold Market Long-Term Update 12/24 months
📊 Technical Outlook Update
🏆 Bull Market Overview
▪️2weeks/candle price chart
▪️Gold Bull market in progress
▪️1976/1979 650% gains - Bull Market 1
▪️1999/2012 650% gains - Bull Market 2
▪️2016/2027 650% gains- Bull Market 3
▪️Price Target BULLS 7500 USD
▪️650% gains off the lows
▪️will hit in 2026/2027
⭐️Recommended strategy
▪️BUY/HOLD accumulate dips
▪️BUY/HOLD physical gold
▪️BUY/HOLD GLD/GDX

Actionable Nasdaq insights: 11-APRIL-2025Rise and shine, traders! Start your day with actionable Nasdaq insights. Let's grow your skills together, one chart at a time.

Nasdaq insights: 10-APRIL-2025Rise and shine, traders! Start your day with actionable Nasdaq insights. Let's grow your skills together, one chart at a time.

Markets bottom on fearA short term relief is due in the coming days.
I will buy QQQ at the opening of the market, for a few days.
Only the fundamentals (and Trump) will decide if it will be the bottom of a correction or the first bottom of a huge market crash.
I am using here:
- The RSI(14), weekly (below 40).
- The ROC(2), daily (below 10%).
- One other personal indicator
- My personal quant strategy

Nasdaq market analysis: 09-APRIL-2025Good morning, traders! Welcome to today's Nasdaq market analysis. Compare my price action insights with your own charts and enhance your trading skills.

NASDAQ: Cyclical correction most likely completed. ATH by June?Nasdaq remains oversold both on its 1D (RSI = 25.630) and 1W (RSI = 28.851, MACD = -442.980, ADX = 36.399) technical outlook as yesterday's rally is being corrected today on strong technical selling. Long term it looks like this was a cyclical correction, reached -25%, hit the 3W MA50/1W MA200 zone (which has been the best buy entry in the past 10 years) that has most likely been completed. In addition, the 1W RSI is on the same oversold levels as May 16th 2022, the lowest it has been since 2008. According to the Fibonacci Channel Up, the market can hit 22,300 as early as June.
## If you like our free content follow our profile to get more daily ideas. ##
## Comments and likes are greatly appreciated. ##

Nasdaq trading insights: 08-APRIL-2025Nasdaq trading insights: Not signals, but informative zones to aid your decision-making. Please note: These zones are not trading advice. Use them as a starting point for your own analysis.

Modified Count to Reflect Recent DeclineIn truth, the levels we're seeing this morning when the SPX cash market opens, I was not anticipating seeing till the 3rd quarter of this year. Mid last week, we had positive MACD divergences on the intraday charts and was setting up to be almost a textbook bottom.
Nonetheless, the SPX cash market will not hold the must hold zone when it opens this morning. This means we will get a retracement higher in a minor wave B that should last some time. This will represent one the final opportunities traders will have to relieve themselves of excess portfolio leverage and risk.
We very well may spend the summer months retracing higher...but there is no doubt some of you reading this will assume this will result in the resumption of the previous bull market.
It will not be.

NASDAQ Black Monday or a Massive Rally??Nasdaq (NDX) opened on early Monday futures trade below both its August 05 2024 and April 19 2024 Lows. All technical Supports have been broken and the market made new 12-month Lows. The market sentiment is extremely bearish, technically oversold, even the 1W RSI is below the 30.00 oversold barrier and the prevailing fundamentals regarding the back-and-forth Tariffs between nations don't leave much room for encouragement.
The index is more than -25% off the February 17 2025 All Time High (ATH), technically Bear Market territory, and the last time it dropped more this fast is during the lockdowns of the COVID crash (February 20 - March 23 2020). The market dropped by -32%, below also all known technical Supports (including its August low) before finding support and forming a bottom just above the 1W MA200 (red trend-line).
The two time events are virtually identical with the only notable difference is that Nasdaq is about to form the 1D Death Cross now while in 2020 it did about 1 month after the low.
The only technical development that leaves room for encouragement is that the 1W RSI during COVID got oversold just a day before the eventual market bottom.
Does today's 1W RSI drop into oversold territory mean that we are about to form a bottom? Unknown. But what we do know is that on March 03 and 16 2020 on two urgent, out-of-schedule meetings, the Fed stepped in to save the market from the free-fall (and save they did) by cutting the Interest Rates to near zero (first to 1.25% and then to 0.25% subsequently from 1.75% previously).
Perhaps that is the only thing that can restore investor confidence (certainly the only action that the Fed can do) and avoid a Black Monday below the 1W MA200, which would be catastrophic. On the other hand, if the U.S. government reach indeed trade deals with the rest of nations and the Fed do what they can from their end, we may even hit new ATH by August!
So what do you think it's going to be? Black Monday or Massive Rally?
-------------------------------------------------------------------------------
** Please LIKE 👍, FOLLOW ✅, SHARE 🙌 and COMMENT ✍ if you enjoy this idea! Also share your ideas and charts in the comments section below! This is best way to keep it relevant, support us, keep the content here free and allow the idea to reach as many people as possible. **
-------------------------------------------------------------------------------
💸💸💸💸💸💸
👇 👇 👇 👇 👇 👇

QQQ Selling Just StartingIf you have any illusions this will be a buy-the-dip market, you are taking on a major risk!
1. Last time QQQ sold off it lost 84%
2. It took 17 years to break even
3. It took much longer to break even inflation-adjusted
You can't buy low if you don't sell first. You don't have infinite money.
WARNING!

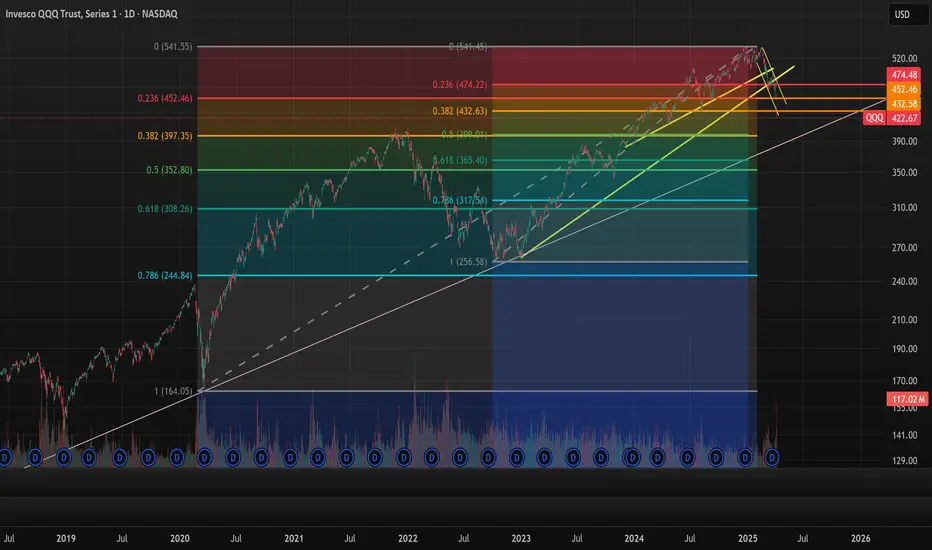
QQQ fibonacci retracementsThis is the QQQ and Fibonacci retracements from 2022 and 2020 to give you an idea of where support may lie. We crashed through support and sit in open air.
3-MONTH THE SQUID GAME II 'JUBILEE'. WHAT IS NOW & WHAT IS NEXTIt's gone three months or so... (Duh..? WTF.. 3 months, really? 😸😸😸) since "The Squid Game" Season II has been released on December 26, 2024.
Nearly month later comrade Trump entered The White House (again).
Still, everyone was on a rush, chatting endless "Blah-Blah-Blah", "I-crypto-czar", "crypto-capital-of-the-world", "we-robot", "mambo-jumbo", "super-duper", AI, VR and so on hyped bullsh#t.
Here's a short educational breakdown, what we think about all of that, at our beloved @PandorraResearch Team.
Trading can easily resemble gambling when approached without discipline, strategy, or proper risk management. Here are key reasons to avoid gambling-like trading behaviors, supported by real-world examples:
1. Lack of Strategy and Emotional Decision-Making
Trading becomes gambling when decisions are based on emotions, intuition, or market hype rather than thorough analysis. For instance, Geraldine lost £15,000 on a spread-betting platform after attending a workshop that taught ineffective strategies. She believed the platform profited from her losses, highlighting how impulsive, uneducated decisions can lead to significant financial harm. Similarly, traders who overtrade or ignore risk management often experience devastating losses, as they rely on luck rather than a structured plan.
2. Overleveraging and One-Sided Bets
Overleveraging—opening excessively large positions—is a common gambling behavior in trading. This approach increases stress and the likelihood of substantial losses. A trader who lost $400,000 on a single Robinhood bet exemplifies this. He overinvested in a call option, hoping for a quick profit, but the trade turned against him, wiping out nearly all his capital. Opening one-sided bets or adding to losing positions further compounds risks, as traders attempt to recover losses through increasingly risky moves.
3. Ignoring Stop Losses and Risk Management
Failing to set stop losses or refusing to exit losing trades is another form of gambling. Traders who cling to their biases and avoid cutting losses often face irreversible damage to their portfolios. For example, many traders refuse to take stop losses, leading to catastrophic losses that erode their confidence and capital. This behavior mirrors the destructive cycle of gambling addiction, where individuals chase losses in hopes of a turnaround.
4. Psychological and Financial Consequences
Gambling-like trading can lead to severe psychological and financial consequences. Harry, a trader with a gambling addiction, repeatedly lost money despite asking his trading platform to restrict his account. His inability to control his trading behavior highlights the addictive nature of high-risk trading and its potential to ruin lives. Similarly, excessive gambling has been linked to increased debt, bankruptcy, and mental health issues, such as anxiety and depression.
5. Long-Term Sustainability
Smart trading focuses on steady gains and minimal losses, whereas gambling relies on luck and high-risk bets. Traders who chase big wins often lose their profits in subsequent trades, perpetuating a cycle of losses. Studies show that frequent trading, driven by overconfidence or problem gambling, reduces investment returns and increases financial instability.
In conclusion, avoiding gambling-like trading requires discipline, education, and a well-defined strategy. Real-world examples demonstrate the dangers of emotional decision-making, overleveraging, and ignoring risk management. By adopting a structured approach and prioritizing long-term sustainability, traders can mitigate risks and avoid the pitfalls of gambling.
--
Best 'squid' wishes,
@PandorraResearch Team

2022 NQ Bear Market Fractal scenarios Index has declined more than 20% and we've failed RSI 40 on weekly, indicating a bear market has started. Best case scenario, I could see it bottoming around 16,666/15000 and recovering very quickly with a blow-off top +100% in less than a year, similar to 2000, topping around 30k-33k.
Bear markets typically last 3M-3Y, with most ending in a year or less. This one topped mid Q1, so mid Q2, Mid-May, might be a great time to buy, if only for a few weeks. Bottoming there after 3M would fit close to orange pattern, or stretch it 3M to bottom mid Q3, October.
Green pattern is the only 1:1 with 2022 top to present, with a bottom around 1Yr and then blue and green are steeper variation bottoming a little later, mid 3Y.
Pink is more of a 2000 top with 3Y bear market, but would just be a recession.
Red is worst case scenario; great depression followed by rapid hyperinflation that sends markets screaming with exponential gains just to outrun inflation.
You can stretch the scales on idea to zoom in and out and see the patterns better, or try drawing your own.
Linked are my ideas from 2022 top. There is more confirming TA, but removed for clarity on an already busy chart.
