Nasdaq100 index weekly viewNasdaq100 index closes up 2.1% last week for the fourth positive week in the longest streak since November.
The index closed on the daily timeframe on Friday above the200EMA (13,412) for the first time since early April, and above the 50EMA (13,486) on the weekly timeframe for the first time since late March.
The index may extend its rally into next week testing 13,980 - 14,300 resistance levels.
NASDAQ 100 CFD

Daily analysis and day trading setups on NASDAQ NDX 20220812Happy Friday,
Line in the sand for NQ_F today is 13300. Bulls want go above 13380 and bears to go below 13230. These 150 pts may end up deciding this battle.
Macro US Michigan Cons. Sentiment Index
Buy
Break: 13380, 13430, 13500/20, 13580
Reversal: 13300, 13200, 13110/085, 13030
Sell
Break: 13300, 13210, 13125/095
Reversal: 13380, 13450, 13510/40, 13600, 13670
Green Goblin levels are here >>>
Fibonacci Confluence levels are here >>>

EURUSD To Potentially Fall After US Core CPI SpikeThe result of today's US Core Cpi data both monthly and yearly:
(Core CPI (MoM) (Jul)
Act: 0.3% Cons: 0.5% Prev.: 0.7%-
Core CPI (YoY) (Jul)
Act: 5.9% Cons: 6.1% Prev.: 5.9%)
showed a strong sentiment of bearishness in regards to the US dollar. Monthly data showed decreasing inflation from the previous month's data and also was less than expected. Yearly data showed inflation flattening out and also was less than expectations. Across the whole foreign exchange market and main pairs the dollar fell short. There are some good opportunities today for a day trade for pairs such as EURUSD, GBPUSD, AUDUSD, NZUUSD shorts, and USDJPY, USDCHF, USDCAD long positions. There should be a market correction after the big US dollar sell off. I will be looking for a 4 hour short on EURUSD and long for USDJPY soon, along with the other currency pairs mentioned.
In regards to the stock market, the S&P500 and NDX100 saw big gains and should continue to see bullishness with inflation decreasing. This is beneficial for the stock market. Meta saw shares rise today increasingly. $EUR/USD$ $S&P 500$ $Nasdaq 100$
Ilyas Khan Top1 Markets

NDXZooming out, NDX looks strong, as per EW rules the 5th wave must match the 1st wave in both time and %.
That said fomo can obviously send the 5th much higher and also terminate the trend earlier.
But for now in respect to the fact that EW is not a crystal ball ,
I would say that since I am counting the 4th wave finished on the week June 13th 2022 the bulls have until July 2023 to finish the 5th wave at my projected target of 18,600.
(not accounting for any Fomo)
Also I expect a correction soon back to 12,300 or there about to make the LTF daily chart W2.

Daily analysis and trade setups on NASDAQ 20220810Happy Midweek, Happy CPI Day,
As mentioned in the analysis yesterday, bears did try to bring NDX below 13k. Bulls have bearly (barely 😇) managed to push it back > 13k.
Line in the sand today is 13070 for NQ_F
Macro: US CPI
Buy
Break: 13060 13180 13265 13325
Reversal: 12995 12930 12850 12790 12720 12940
Sell
Break: 13010 13945 13875 13800 12735
Reversal: 13200 13280 13340 13390 13455 13570
Green Goblin levels are here >>>
Fibonacci Confluence levels are here >>>

Daily analysis and trade setups on NASDAQ 20220809Happy Tuesday,
Macro : US Nonfarm Productivity, Unit Labor Costs
NDX is making rounds in the zone waiting for either leak of CPI today and/or official CPI tomorrow
NQ_F's line in the sand today is 13260. Bulls want to go above 13380 and bears want to push it below 13k handle.
Buy
Break: 13225, 13350, 13435
Reversal: 13090, 13000, 12930, 12860
Sell
Break: 13115, 13020, 12950
Reversal: 13240, 13375, 13450, 13535, 13610
Green Goblin levels are here >>>
Fibonacci confluence levels are here >>>

Daily analysis and trade setups on NASDAQ 20220808Happy New Week, Happy Monday,
Nothing significant on economic calendar today.
With academic vacation & summer in full swing, markets may range unless some geopolitical development happens.
Line in the sand is 13180
Buy
Break: 13260, 13350, 13420
Reversal: 13170, 13110, 13040, 13900, 12820
Sell
Break: 13180, 13120, 13050
Reversal: 13300, 13360, 13440, 13520, 13580
Green Goblin levels are here >>>
Confluence fibs are here >>>

NAS100USD BACK TO SHORT ?NAS100 was near at strong resistance zone, don't forget try to short here.
This is not financial advice. This is for only my private trade plan. If you have follow at your own risk.

nasdaq updateIt's just x wave , don't enjoy it very much :-)
Another uptrend for 5th of terminal c and it will go down for new low

Imminent pullback on the $NDXNobody knows where the market is going... but, the $NDX is at the top of its mid-term bearish trend (White line) and at the top of its short-term bullish trend (Yellow). Lot of space for a pullback. After that? I hope to have a higher low and return to a bullish mid-term trend.

Short Squeeze is over in price scaleIt seems the condition of market is peculiar. Invert of yield curve and data from CALL/PUT ratio signal bearish state to the market. furthermore Technically it was the first leg of downtrend. There will be time squeeze for positions to bring back balance to the market.

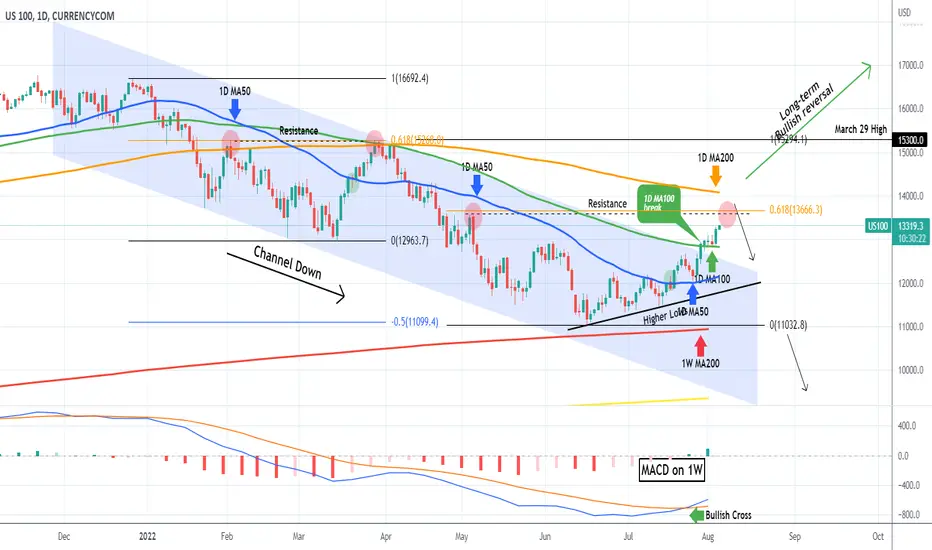
NASDAQ close to entering back to the bull marketNasdaq (NDX) extended the uptrend following the two clear break-out buy signals given by the 1D MA50 (blue trend-line) and the 1W MACD Bullish Cross, as we outlined on our previous analysis 3 weeks ago:
Perhaps the most important development since then is the closing above the 1D MA100 (green trend-line) which last time rejected the price (March 29) and formed a Lower High on the long-term Channel Down. This doesn't turn the trend bullish long-term. It remains bearish unless we break above the 1D MA200 (orange trend-line), which isn't that far off. It was that and the 0.618 Fibonacci retracement level (13666 currently) that along with the 1D MA100 rejected the uptrend on the previous Lower High.
As a result a sell there with a tight SL on the 1D MA200 can be justified, targeting the 1D MA50 on the short-term. On the other hand, a close above the 1D MA200 should be considered a buy break-out signal, which can target the 15300 March 29 High.
--------------------------------------------------------------------------------------------------------
Please like, subscribe and share your ideas and charts with the community!
--------------------------------------------------------------------------------------------------------
Daily analysis and trade setups on NASDAQ 20220804Happy Thursday & Happy BOE day
Momentum is bullish. We trade candles and not predictions. It doesn't matter what economic outlook is bearish if the Mr.market wants to go up.
13200 is our pivotal line in the sand. Buy above and sell below to get rich slowly.
Macro: ECB Elderson Speech, GB BOE (everything), US Trade Balance, Jobless Claims, Fed's Mester Speech
Buy
Break: 13340, 13400, 13490
Reversal: 13200, 13120, 13050, 12990
Sell
Break: 13210, 13130, 13060, 13000
Reversal: 13340, 13390, 13490, 13550, 13640
Green Goblins chart here >>>
Confluence level chart here >>>

$NAS100 - Nasdaq at profit taking zoneNow might be good idea to take profits.. and if it dropped for correction the next long entry would be around $12300
🚩 Bullish above $13212 bearish below.
Reminder: Don't get trapped or misleaded by news charts don't lie 👇

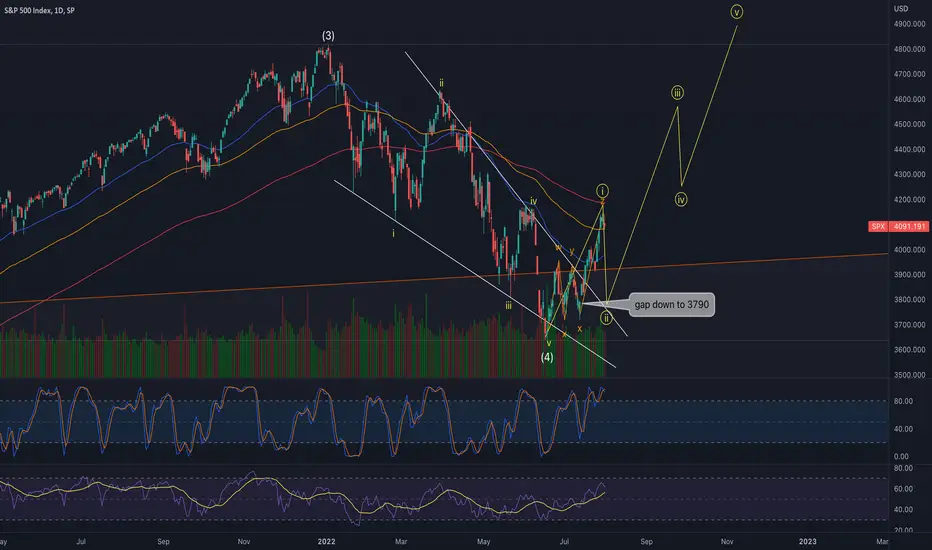
SPX500Seems like the perfect time to fill the gap down to 3790 retest the breakout of the leading diagonal and confirm wave 2 is what we want to see.
Pelosi in Taiwan today and China about to fail to start WW3 IMHO. ;)
Daily analysis and trade setups on NASDAQ 20220802*** Tradingview has hidden my analysis for August 1, 2022 because it contained a link to my twitter profile. ***
This is likely to be relatively quiet day unless some news appears. Europe is on vacation & US is slow. Resulting in low volumes and jumpy ticks.
Even with yesterday's candle, the bulls are firmly in-charge. As far as 12265 is maintained, it can go on to test 13230. Breaking that will open up 13900 and then 14581. But this is more in hourly/daily TF.
For today, 12830 is anchor line. Buy above, sell below.
Macro: US Fed Evans Speech
Buy
Break: 12860, 12890, 12900, 12960, 13040
Reversal: 12800, 12760, 12680, 12570
Sell
Break: 12810, 12775, 12700
Reversal: 12980, 13100, 13260, 13400
Green Goblin Fib levels are here >>
Confluence Fib levels are here >>

Tesla update target is 400$all indexes are topped out and overbought. if u compare Nasdaq with Tesla u can see that March rally is the same too and it will be over soon. deja vu!!!!


Daily analysis and trade setups on NASDAQ 20220729Happy Friday & Happy End of the Month Day
NASDAQ is firmly in a position to continue rally provided it continues to HH/HL above 13050
The point to note is that this is the last trading day of July 2022
Macro: Core PCE, PI + PS, Chicago PMI & Michigan CSI
Buy
Break: 12950, 13050,13110
Reversal: 12770, 12670, 12590, 12430, 12270
Sell
Break: 12800, 12640, 12580, 12475
Reversal: 12950, 13060, 13125, 13220, 13415
Fib levels are here >>>
TI Fibs Confluence levels are here >>>

Nasdaq100 NDX Monthly Close Snapshot
Nasdaq100 index has rallied 12.55% in July to record the best monthly performance since April 2020.
Moreover, bulls have formed a monthly bullish engulfing candlestick - above the 100-EMA support region - to be confirmed by a higher open on Monday.
The positive sentiment is still intact to be challenged by 13,000 - 13,490 supply area.

ETHThinking something like this. The tech sector NDX can run back to 13,500 so assuming that possibility ETH will likely follow. I recently posted my NDX chart and it looks almost exactly the same as ETH. Falling wedge overthrow and reclaimed the bottom TL. Now the top TL is a target for the bulls with the momo that they currently have.

SPX 500 2008 AND 2022 🤔📉History does not repeat itself, but it rhymes.
Over time we have seen how there are economic recessions every 8 years to 15 years.
The US reported 2 negative quarters which is already a technical recession but the FED tries to hide it with yesterday's news (July 27, 2022), there are still key dates to potentially short almost everything including BTC, CRYPTOCURRENCIES, STOCKS and INDICES. The key dates to keep an eye on the market are:
1. August 5 (NFP) - August 10 (Annual Inflation).
2. September 1 (Non-agricultural employment change).
3. September 21 (FED Open Market Committee Economic Projections).
The economic downturn is here, so Meta must do more with less - Mark Zuckerberg (Wednesday, July 27 in the "Meta Platforms" erning report)

NDX is painting the biggest Head and shoulders in Nasdaq History This pattern getting painted filled with false hope of people thinking the damages from QE since 2008 and the Pandemic printing are over is very alarming if it plays out.
It was terrible enough seeing people lose fortunes / life savings during the recent collapse of the simpleton's running VC funds with insane leverage without telling people where their funds was, I caught onto this with Luna and a some lending platforms but not many people listened due to euphoria of price only go up.
Now the global economy is about to retract due to governments not supporting supply side of the business cycle and only creating demand via printing causing inflation and more poverty (due to businesses failing to meet profits causing less staff and a deflationary death spiral), this is magnitudes larger than what happen in the crypto space and what happen in 2008 combined with 2000. If this market starts to turn bearish and margins are not met, money that does not exist starts to get claimed, defaults start to happen, panic starts to happen.
Now is a great time to re evaluate where your funds are, are they safe from bail in inflation? are they protected from bail outs?
The federal reserve has one plan and one plan only.
• Raise reward rate for reverse REPO (Build a functioning bail out dam that can be literally controlled released)
• Raise Interest rate's collapse the bubble in all major markets (hoping to contain the current inflation outbreak)
• Panic mode but here's where the FED will step in and start to reduce the reward rate to ZERO
• Money starts to flow back into normal markets as any money still in the RRP will be earning nothing
• Majority will flow into US 20 year bonds causing the yield to collapse, funding the government, THIS is what JAPAN is counting on happening as they're directly involved, they hope to be able to make up for their unlimited bond purchases by selling US Government bonds at a premium
• Some money will start to flow into all equity markets from Government funding new infrastructure, and money going directly into markets from the RRP
• The will be all unfolding when the RRP award rate starts to fall do not focus on reserve rates
• All of this to reset the biggest bubble in history that will clearly put the world into a deflationary spiral to avoid needing to hyperinflate right now, everything I just explained is essentially to avoid hyper DEFLATION the big money from the QE / Stimulus is sitting in the RRP like the FED wants to be ultimately unleashed like the Three Gorges Dam during or after the collapse of the global economy
ALERT - - - - - - - IF this does not work to restimulate markets and there is still deflationary pressure the global reserve banks will be forced to start printing more money than you have ever thought possible think hundreds of trillions, the thought of hyperinflation will be accepted if the world is in a hyper deflationary death spiral this could genuinely end our human species due to quality of life dropping dramatically
Everything is happening now because of the absolute stupid decision idiotic insane unthinkable theory to start a program of unlimited QE and stopping the bust of the the natural boom and bust cycle filtering out all the bad actors, avoided the bust for what? everlasting inflation that the average person cannot outrun and start a family and population decrease is starting to happen. .
Good luck people -
