NASDAQ last barrier to break. Consolidation until then.On my most recent Nasdaq analysis 2 weeks ago, I laid out the key pressure levels of the uptrend that started after the March 15 bottom:
As you see, the index invalidated the Channel Down and by breaking above the 1D MA50 (blue trend-line), it naturally reached as high as the 1D MA200 (orange trend-line), which broke yesterday. However, it is clear that the wider pattern has been a Falling Wedge and not surprisingly, the index is currently struggling to break above its Lower Highs (top) trend-line.
If the news of this week (starting today with the GDP and completing on Friday with the Nonfarm Payrolls) turn out bullish enough to manage a break above the Wedge, then NDX will target the next Fib in line, the 0.786 retracement level (15870) and then complete the correction's recovery at 16670 (requirement is for one 1D candle to close above each Resistance level). Notice how yesterday's top came exactly on the 0.618 Fib.
If however the price gets rejected on the Lower Highs (and 0.618 Fib), expect a short-term consolidation within the two MA periods, with the 1D MA50 in support. Breaking below the 1D MA50 will be far from ideal, putting at risk the 0.236 Fib and the March 15 Support.
--------------------------------------------------------------------------------------------------------
** Please support this idea with your likes and comments, it is the best way to keep it relevant and support me. **
--------------------------------------------------------------------------------------------------------
NASDAQ 100 CFD

NAS100 USD NQ1! NASDAQ 2022 Mar 28 week
NAS100 USD NQ1! NASDAQ 2022 Mar 28 week
Some concern with weakening upward momentum.
Possible Scenario:
1) Market attempts last supply 15160. Keep stops tight if long
and if bar spread is narrow, market may be trapping longs.
2) Due to weakening momentum, market may test lower levels
for long on retracement opportunity. The retracement has to
come down on lower bearish volume.
Weekly = Average vol up bar closing off high, mark up on
narrower spread = weakness
Daily = Average vol down bar, close above middle, but level with
previous bar = No supply
H4: Level closes, shortening of thrust = weakness
Price reaction levels:
Short on Test and Reject | Long on Test and Accept
16767 16481 15992
15492 15160 14685
14443 14025 13666
13025
Remember to Like and Follow if you find this useful.
Have a profitable trading week ahead.

NDX W-Shaped RecoveryI think we might see the end of the war soon.
Russia says the first phase of its “military operation” in Ukraine is mostly complete.
I am considering a W-Shaped Recovery on NDX and a price target of $15670.
Looking forward to read your opinion about it.

NDX : Continue lower or finish the correction here? According to RSI , Nasdaq could finish its correction target at the current level
but if the overall market and world's economic don't get better
then it could continue lower to the next support.
.
Lets see if this support hold and we retest above resistance again

Nasdaq100 Weekly Review Hey y'all so I wasn't at my finest this week. Had loads of technical issues and I couldn't keep up. Haha! occupational hazard. Anyway, I was able to take a trade that gave me some great pips. This week, the bulls took us by surprise. This is how my week went, How did yours?
P.S: After this video, stay tuned for the strategy used and how to apply it.

NAS100 USD NQ1! NASDAQ 2022 Mar 21 week
NAS100 USD NQ1! NASDAQ 2022 Mar 21 week
Market tested 13000-13100 and provided long opportunity.
Price is now about previous high.
Possible Scenario:
1) Market returns below 14327 and back into the 14327-13100
rotation zone.
2) Market finds acceptance at the 13900/14327 levels for
long opportunity.
Weekly = Average volume up bar closing at high = strength
(strong reversal bar)
though still weak
but weakness still present.
Daily = Average volume up bar closing at high = strength
H4: Average volume up bar closing at high = strength. Concern is
the previous ultra high volume bars didn't show result from effort.
Exercise caution if long, keep stops tight.
Price reaction levels:
Short on Test and Reject | Long on Test and Accept
16767 16481 15992
15492 15160 14729
14391 13900 13246
13025
Remember to Like and Follow if you find this useful.
Have a profitable trading week ahead.

NASDAQ Still bearish despite the RSI break-outNasdaq has been trading within a Channel Down since the January 24 Low. The index is approaching today the top (Lower Highs trend-line) of the Channel and will remain bearish, unless it breaks above the 1D MA50 (blue trend-line), which comfortably sits just above the top of the Channel. That should target the 1D MA200 (orange trend-line), which trends just below the 0.618 Fibonacci retracement level.
If the price is rejected though at the top of the Channel Down or on the 1D MA50, expect a re-test of the 12930 Support and if broken the -0.236 Fibonacci extension. It has to be said though that the 1D RSI broke yesterday above the Lower Highs trend-line since November 04. That is the first bullish sign since the correction started.
--------------------------------------------------------------------------------------------------------
** Please support this idea with your likes and comments, it is the best way to keep it relevant and support me. **
--------------------------------------------------------------------------------------------------------

NAS100 - Signs of a reversalYesterday (March 16th 2022) the FED announced a 0.25% rate hike, following this news there was a quick selloff in stocks with the NAS100 index down a little over 2% within 30 mins of the release, but a sharp rebound allowed NAS100 to finish the day up over 4%.
Although we have seen some decent gains this week we are still below the trend-line resistance and are yet to see confirmation that the trend has reversed, although with strong bullish divergence showing on the 4hr chart, a break of the 13850 resistance, and now testing the 10 week trend line we are starting to see signs that a reversal could be in play.
If the 13850 level holds as support, I imagine the trend-line will break before the weekly close, and this will provide confirmation of a reversal. If we close below the 13850 resistance level, I will be looking to the 20 and 50 EMAs (4hr) sitting around 13600 for support, if this fails to hold then I think we will move back down to test the lows (12900 - 13100)
Short-term view: Bullish (supports to hold, reversal in play)
Medium-term view: Bullish (new ATH in coming months)
Long-term view: Bearish (stock market crash within the coming year(s))

NDX Classic Bubble?NDX is looking like a classic bubble for the time being. All the events line up really nicely for the bull run. Now let's see how diamond handed everyone truly is. Opened SQQQ position with no limit.

Some Upside Could Be On Its Way Hey Guys, just an update on how the market correction is going. Even though I'm extremely bearish on the market in the year to come there is always bull rallies in declines and regardless my bearishness you have to look at the evidence on the charts and follow. We have a bullish divergence on the RSI and the price chart is tightening into a Bullish Pennant these are extremely strong reversal signs. Going back in history this seems very similar to what happened in 2008(image below) where we had a rally up before the major sell off started again this also goes well with seasonality were we on average bull in late March into April before correcting. We would need a "Lehmen Brothers" event to start the sell off and with the major banks in Europe getting slammed it could happen but it wont be until later in the year we see this unfold. But for this little upside my target is around 15200 which has a confluence of resistance being the top of the Pennant, earlier support and resistance, the Fib sacred .618 level and the 150 ma.
Like and follow to stay informed with this trade.

NAS100 USD NQ1! NASDAQ 2022 Mar 14 week
NAS100 USD NQ1! NASDAQ 2022 Mar 14 week
Last week's short on break of 13700 worked
well. Market may test 13000-13100.
Again watch for reaction at the levels to
determine entry.
Weekly = Average volume down bar closing off low = some demand
though still weak
but weakness still present.
Daily = Low volume down bar closing at low = weakness
Price reaction levels:
Short on Test and Reject | Long on Test and Accept
16767 16481 15992
15492 15160 14327
13900 13246 13025
Remember to Like and Follow if you find this useful.
Have a profitable trading week ahead.

Nasdaq 100 - Confirmation or invalidation of the bottomOn 24th February 2022 the Nasdaq 100 index plunged to as low as 13 025.75 USD. Then on 3rd March 2022 it saw a rebound to 14 391 USD; and then on 8th March 2022 NQ1! started falling again before halting its decline at 13 103.25 USD. Shortly after, this was followed by another rebound in price of NQ1!. We think market participants are growing increasingly anxious as volatility remains highly elevated and FOMC is coming closer by each day. We think it is likely for the market to mute down a little bit ahead of an important FED's meeting. FED is projected to increase interest rates by 25 basis points on 16th March 2022. If FED manages to deliver its promises then we think it is likely for the general stock market to follow through with further weakness and selling pressure.
Technical analysis - daily time frame
RSI is neutral. Same applies to MACD which, however, still remains in bearish territory. If MACD manages to break above 0 points then we expect it to bolster the bullish case for Nasdaq 100 index. Stochastic points to the upside which is bullish. DM+ and DM- are bearish. ADX exhibits growth which suggests the bearish trend is either near its peak or it is gaining more strength. Overall, the daily time frame is neutral.
Illustration 1.01
Picture above shows the daily chart of NQ1!. Previously we noted it is possible that the Nasdaq 100 index has bottomed out. We will observe its price action next week and we will look for possible confirmation or invalidation of our thesis.
Technical analysis - weekly time frame
RSI and MACD continue to develop their bearish structures which is negative for NQ1!. Stochastic oscillates in the bearish territory, however, it managed to reverse to the upside which is positive. DM+ and DM- show bearish conditions in the market; ADX increases which suggests the prevailing trend is gaining further strength or it nears its peak. Overall, the weekly time frame is bearish.
Support and resistance
Please feel free to express your own ideas and thoughts in the comment section.
DISCLAIMER: This analysis is not intended to encourage any buying or selling of any particular securities. Furthermore, it should not serve as a basis for taking any trade action by an individual investor. Your own due diligence is highly advised before entering trade.

Nasdaq Analysis Hi Everyone,
Nasdaq is still very bearish as we can see on the daily timeframe, we have this long wick that needs filling, I will be waiting to see the best entry for nasdaq sell, Currently the market is retracing and looking at the chart it looks like it will go to areas of 13743 or 13927 before pushing back down to 13400 area. Break of 13400 area will take us to 13066 which i think we may see by end of this week.

NAS100 - Next Swing Low for Potential Buyers😍Previously -
Simple, we like to see price drop for us to add to our long positions
Use our analysis as a sentiment
Analysis is only 1 piece of the puzzle 🧩
Our analysis is a sentiment for the upcoming week, month.
Use this as a weather forecast, you are the person that has to put on a jacket when it’s raining.
Trade this sentiment based off your own entry strategy at the right time.
Flow with the Devil 😈
Trade with the manipulation👾
STAY UPDATED BELOW!

NAS100 USD NQ1! NASDAQ 2022 Mar 07 week
NQ1!
NAS100 USD NQ1! NASDAQ 2022 Mar 07 week
Last week, supply > demand for short, yet is a difficult week,
having to frequently re-calibrate the Asian vs US hours.
Market showing a topping, which may present
opportunity to short on retracement.
If 13700 is broken, market may test the lower levels.
Weekly = Average volume down bar closing off low = some demand,
but weakness still present.
Daily = Average volume down bar closing off low = some demand
Price reaction levels:
Short on Test and Reject | Long on Test and Accept
16767 16481 15992
15492 15160 14300
13700 13246 13025
Remember to Like and Follow if you find this useful.
Have a profitable trading week ahead.

Nasdaq100 What To ExpectWho’s In The Nasdaq Market And What Are They Doing?
Presently, the bulls.
However, from the looks of things, it seems we are at equilibrium. The divergence that popped up on Thursday was no jokes. In the market presently, there are four different levels: The 14200, 14400, 14600, and 15000 levels respectively.
These levels all have resistance and at least some buyers and sellers ready to either take the market up or slash that damn—price. They are strong levels. If broken by the bulls, they become support meaning; the bulls become stronger. I mean for them to last, we need more support right?
What Chart Patterns Are Visible, The Current Market Structure, And Stage Of The Ndx
As for chart pattern visibility, That divergence and double bottom are pretty obvious right? Albeit, that empty daily wick the bears abandoned at the 13,000 level mean something as well. There’s an unfinished business by the bears at that level.
Who knows, maybe an inverse head and shoulder might form. Well with that—I think the bulls might just be winning this one. However, we need more signs—these bulls can’t leave us empty. If you know your market cycle well, you would know the current stage the market is at is—either: the dip or finally at the bottom. That accumulation might just be forming. An accumulation means, there’s hope.
Finally, the market hasn’t actually formed a new lower high yet. So like I said, “the bears definitely have an unfinished business”.. We need lower highs or higher high—the highs are still void at the moment. As for the lows, we have two lower lows. Hmm, what can that mean? The bears are probably saying, “we’ll be back”. On that note, “I’ll be back too”.
Have a great week.

Nasdaq 100 - Has the Nasdaq 100 index bottomed out? The Nasdaq 100 index fell approximately 22% between 22nd November 2021 and 24th February 2022, with the latter date marking the beginning of the Russian invasion into Ukraine. Since the beginning of this military conflict the Nasdaq 100 index managed to rise approximately 8% which marks its retracement from bear market territory. Recent geopolitical events have a tremendous effect on the world economy as they brought new, even stricter, sanctions against Russia which was banned from the SWIFT payment system. Shortly after, this was followed by numerous multinational businesses deciding to leave the Russian market. Overall, this has great economic implications for Russia as well as the world. Further, this may result in a change of narrative by the FED. We previously noted that we expected upcoming rate hikes to pose a substantial threat to the U.S. economy. Although, odds of a rate hike in March 2022 fell dramatically over the past week. We actually think the FED may postpone its rate hike decision into late 2022 or even into 2023. This could be potentially bullish for the stock market and it could result in trend reversal from bearish to bullish. We will monitor price action closely in the following days as Russia and Ukraine are set to continue peace talks. Progress in these talks would further bolster a bullish case for the Nasdaq 100 index.
Technical analysis - daily time frame
RSI shows divergence (with price making lower low and RSI making higher low simultaneously). Stochastic reversed to the upside altogether with MACD. However, MACD still remains in bearish territory. DM+ and DM- continue to show bearish conditions in the market. However, ADX contains high value which suggests the bearish trend is near its peak or it peaked already. Overall, the daily time frame exhibits first bullish signs of possible trend reversal.
Illustration 1.01
Illustration above shows the daily chart of Nasdaq continuous futures (NQ1!). It also shows the Relative Strength Index below the chart. Divergence can be observable between the price and RSI.
Technical analysis - weekly time frame
RSI and MACD continue to be bearish. Stochastic oscillates in the bearish area, however, it managed to reverse to the upside which is a bullish sign. DM+ and DM- show bearish conditions in the market. ADX grows which suggests the bearish trend of higher degree is gaining momentum. Overall, the weekly time frame remains bearish.
Illustration 1.02
Picture above shows the daily chart of Nasdaq continuous futures (NQ1!). Volume bars are depicted below the graph. Decline in volume since 24th February 2022 can be observed. This may point to decline in selling pressure.
Support and resistance
Please feel free to express your own ideas and thoughts in the comment section.
DISCLAIMER: This analysis is not intended to encourage any buying or selling of any particular securities. Furthermore, it should not serve as a basis for taking any trade action by an individual investor. Your own due diligence is highly advised before entering trade.

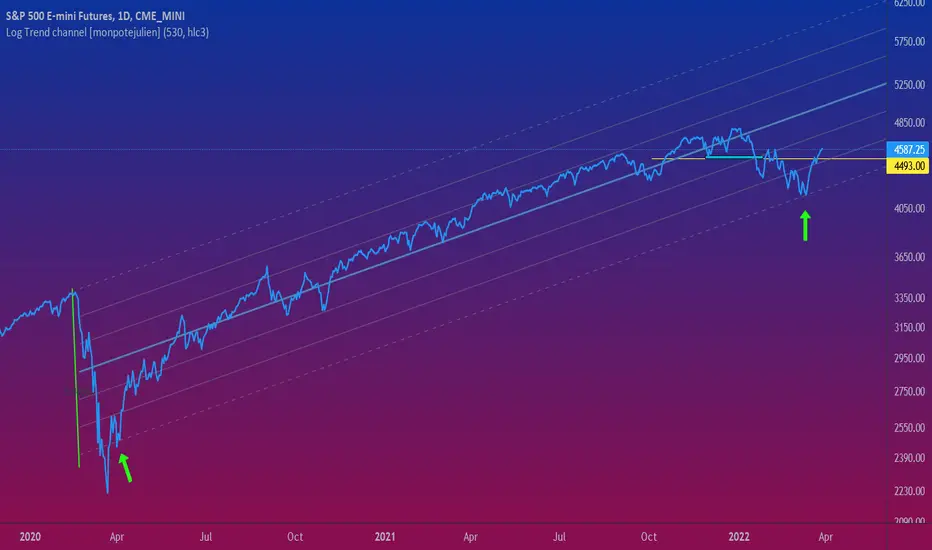
NASDAQ changing channel bands for the next 10 years?This is Nasdaq on the 1M time-frame since the recovery from the sub-prime mortgage crisis was set in motion in 2010.
As shown, the index has been trading within a Channel Up (log chart) from 2010 until mid 2020. Then in July 2020, it appears that NDX switched bands to one zone higher, illustrated perfectly by using the Fibonacci Channel extensions. As you see, since July 2020, the Fib 1.0 level which was previously the Resistance (top/ Higher Highs trend-line) of the former 2010 - 2020 Channel, has turned into a Support (bottom/ Higher Lows trend-line), and is being currently tested by the current 1M candle of February.
Every such Channel bottom test, has been a unique long-term buy opportunity during these +10 years. With the 1M MA50 (blue trend-line) rising rapidly towards the 1.0 Fib level, do you think that will turn into a Support for the next 10 years? Based on this pattern, that looks like the most probable scenario.
P.S. Check also the very consistent Resistance and Support levels on the RSI.
--------------------------------------------------------------------------------------------------------
** Please support this idea with your likes and comments, it is the best way to keep it relevant and support me. **
--------------------------------------------------------------------------------------------------------

Death Cross on the NDX this weekTypically, getting the death cross is not a good week for an index. This is a big warning this week to start a new month.

NAS100 USD NQ1! NASDAQ 2022 FEB 28 week
NAS100 USD NQ1! NASDAQ 2022 FEB 28 week
Last week's short on break of boundary was fruitful, with price
reaching a major demand area. Thereafter, demand came in
strongly to protect their position, presenting to us a wonderful
long opportunity.
Preference will be to long on retracement.
Scenarios:
1) If market comes down on low volume, look for long when price
finds support.
2) Supply overcome demand for short
Weekly = Average volume down bar closing off low = some demand,
but weakness still present.
Daily = High volume shakeout followed by average volume up bar
closing at high = Strength
H4: Very High Volume up bar closing at high = Strength.
Price reaction levels:
Short on Test and Reject | Long on Test and Accept
16767 16481 15992
15492 15160 14180
13700 13246 13025
Remember to Like and Follow if you find this useful.
Have a profitable trading week ahead.

Ndx: Happy President's Day#nq It's 12am, the holiday continues due to the president's day and I thought, "make a video before you crash". Yup, I marked some levels on my chart as you can see.
These are levels I'm looking at. The Nasdaq100 is currently at the end of both the daily and hour 4 channels and I don't know what this means for the bulls. Two possible scenarios involves the market creating support and a possible divergence while bringing the bulls backs or it breaks and resistance is created whilst going for the 13k mark.
What's it going to be? Huh..
Levels:
Toc-14700
Moc-14300
Eoc-14000
Again, Happy president's day.

Nasdaq 100 - Upcoming FOMC poses threat to further rise in priceLast week major U.S. indices attempted to reverse to the upside. This was accompanied by technical indicators trying to break their medium-term bearish structures. However, RSI, MACD and Stochastic failed to fulfill this transformation which resulted in market meltdown. Nasdaq continuous futures (NQ1!) broke below significant support level at 14 031 USD. At the same time, volume saw an increase which signals that the selling pressure is strengthening. The FED's meeting is coming closer and the prospect of higher interest rates poses substantial threat to further rise of NQ1!. We expect selling pressure and elevated volatility to stay persistent ahead of the FED's meeting. We think the upcoming increase in interest rates will put additional stress on the U.S. economy; indeed, we think it will drag major indices lower. Because of that we would like to set a short-term price target for NQ1! to 13 750 USD and medium-term price target to 13 500 USD.
Technical analysis - daily time frame
RSI, MACD and Stochastic are bearish. DM+ and DM- show bearish conditions in the market. ADX resumed growth which suggests the downtred has awakened and started to strengthen again. Overall, the daily time frame is bearish.
Technical analysis - weekly time frame
RSI, MACD and Stochastic are all bearish. Same applies to DM+ and DM-. ADX exhibits growth which signals that the downtrend started to gain momentum again.
Support and resistance
Short-term support lies at 13 706 USD. Support 1 is at 12 915 USD and Support 2 at 12 207.25 USD. Resistance 1 appears at 15 260 UDS and Resistance 2 lies at 16 009.25 USD. Major resistance level can be found at 16 767.50 USD.
Please feel free to express your own ideas and thoughts in the comment section.
DISCLAIMER: This analysis is not intended to encourage any buying or selling of any particular securities. Furthermore, it should not serve as a basis for taking any trade action by an individual investor. Your own due diligence is highly advised before entering trade.
