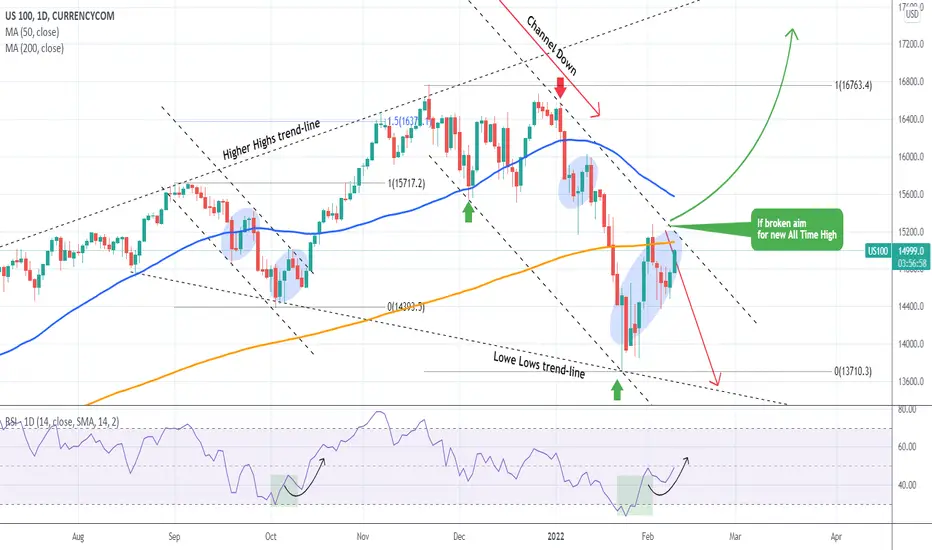
NASDAQ is about to break into long-term bullish territory again.Basically this is a quick update to my January 31 analysis on NDX where I made a case for the importance of this Channel Down:
Initially the price got rejected near the top (Lower Highs) trend-line of the Channel Down but since yesterday, it is staging a comeback. As mentioned before, a break above it, will most likely restore the long-term bullish trend on Nasdaq and will aim for new All Time Highs (potentially near the 1.5 Fibonacci extension long-term).
The finding of the current idea though, is that the current Channel Down resembles that of the previous correction during September 06 - October 13 2021. For a better illustration, see that Channel below on the 12H time-frame, where th MA50 and the MA200 trend-lines are similar to those of the current Channel Down on the 1D time-frame:
Breaking above the 1D MA50 this time, most likely confirms the above.
--------------------------------------------------------------------------------------------------------
** Please support this idea with your likes and comments, it is the best way to keep it relevant and support me. **
--------------------------------------------------------------------------------------------------------
NASDAQ 100 CFD
NASDAQ - Clear signals neededFollowing up on my call to go long on 25. of Jan (& Update of 1. Feb - to close or adjust stop loss).
The price is currently on the Fibbo retracement level 0.5.
What we want to see to confirm a long: Stoch - RSI crossing and a close above EMA 9
What we want to see to confirm a short: Breaking the current Fibbo level and RSI - SMA crossing & depending on the situation a break of the resistance area.
->Updates will follow
If you enjoy this analysis, thumbs up!
________
🚀 Follow for daily posts
🎯 About my posts: They are kept self-explanatory to avoid overcomplicating. Mostly price signals and trend analysis combined with chart patterns.
Disclaimer: This is not an investment advice

Nasdaq100- New leg down?In my previous Nas100 analysis I said that I work with 3 bearish scenarios in Nasdaq's case, and the last scenario proved to be the correct one so far, with the index reversing from 15k zone resistance.
At this moment, the index is trading just above 14.400-14.500 zone support and I expect continuation to the downside.
In my opinion rallies around 15k should be sold and only the index above 15.500 would put a pause in this bearish scenario.
Bears can target 12.500, keeping in mind the last low as support also.
Best regards!
Mihai Iacob

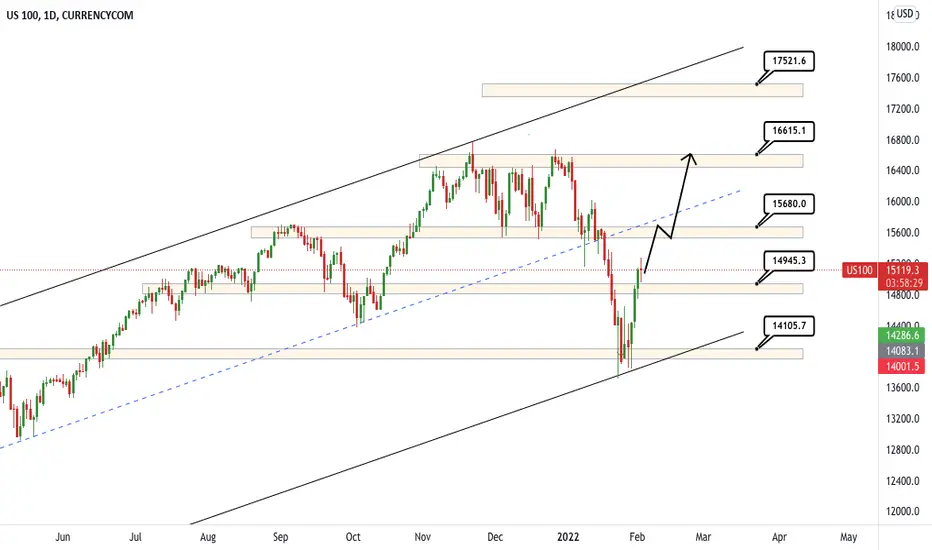
Nasdaq Daily Timeframe Analysis HI Everyone,
As we can see the pullback on nasdaq is over and i expect the trend to continue. The market is still very bullish and i have no doubt we will reach previous high and most probably new highs too.
The market has been respecting these key levels i drew weeks ago so well, and many of you guys PM me with amazing results.
Our next target will be 15680-15700 which may be reached today. This will take us back to the centre trend line, that had previously been broken to reach 14100. If we do break this centre trend line then price will continue to go up to 15615-16780 previous highs.
stay in the loop as i will be posting more on the lower timeframes
Is The Correction Complete?Last week closed above important support for the Nasdaq and this week has opened strong as well. Does this mean that the correction is over?

$NDX #NASDAQ May test the breakout zone.NASDAQ:NDX May test the breakout zone.
Follow, like and share for more updates...
#AHMEDMESBAH

NASDAQ long - As projected *UpdateAs already predicted before (26. 01 & 25. 01 ) NASDAQ is up. We are now at our predefined target no. 1 (see previous posts) - which is the EMA 200 line (orange line). Adjust your stop loss to the level of 14602 (below the support) or close your position now (to reopen it after a possible rebound). The second long target stays the same - which is the lower line of the long-term trend channel (blue line).
If you like this analysis - thumbs up!
________
🚀 Follow for daily posts
🎯 About my posts: They are kept self-explanatory in order to avoid overcomplicating and confusion. Mostly price signals and trend analysis combined with chart patterns.
Disclaimer: This is not an investment advice

Nasdaq100- Bulls should be careful from now onThere has been a very bad start of the year for Nasdaq (and US indices in general) with the price dropping almost 3000 points from top to bottom.
Last week the index found support and bids under 14k and now is in recovery.
In my opinion, this is just a correction and rallies above 15k should be considered good opportunities for selling.
A daily close above 16k would make me change my opinion

AAPL, Can become the market savior? Can Apple become the market savior? Is it able to help the panic to be over? Lets follow !
Previous Monday we saw the large money inflow by hedge funds which pushed it back to positive territory after near 5 % fall in NDX 100 , then panic returned to the market after J erome Powell's speec h and finally exceptional earning report of Apple brought the positive sentiment back to the market ! Can Apple continue the bull run? Lets follow !.
After making a new ATH at 182.9 and exceeding the 3 trillion USD market cap , AAPL started a corrective ABC from of decline down to 154.70 low where it found a support which was really strong. As shown on the chart, this strong support formed by : 0.382 Retracement of wave 3 , 0.618 Retracement of circled wave V and static support corresponding to top of circled wave iii . We can add also 100 days moving average to see the support even stronger.
In broader view, AAPL is possibly completing wave 5 of a wave cycle started at 103.1 on 21th Sep 2021 . This final wave 5 may push the price up to around 200 USD . Going through details of this wave cycle, We find out we have an extended circled wave v of 3. This wave 5 extension happened for many other stocks like MSFT and AMD and indexes as well.
In upper left side of the chart, I showed a schematic drawing of an extended wave 5 and it's typical related Retracement amount and pattern. As it is clear , Apple beautifully resembles this pattern . Another supportive point for the analysis !.
What is shown on the chart, is normal scenario. There may be some more optimistic and pessimistic scenarios whit higher and lower targets but, We just kept them away from the chart to make it clean. Should it need any update, We will do it later.
Stochastic indicator has made a bullish reversal at oversold zone , Body of last candle well closed above the down trend line and is now inside the territory of decline form ATH to 168.17 which may be wave A of the possible ABC form of correction which is another positive sign.
Despite all above positive and bullish signs , AAPL may choose completely different path than we are expecting therefore, we have to set our stop loss objectively ( Which is the last formed low at 154.7) and stick to it . We know after an ABC form of correction, Stocks can take many various complicated forms.
We do not know how market continues it's path however, we can see the signs, make our analysis and take a position. If somebody fears of taking a long position ( of course with an objective stop loss) for this setup because of bad news everywhere or panic , he/ she would better to leave the world of trading. Risk is always is with us in trading and the best thing we can do is to manage our risks.
Good luck every one and wish you huge profits.

NASDAQ Channel Down emerged. Trade the rejection or break-out.Nasdaq has suffered the most during January's correction. The Lower Lows created a new Channel Down which we have to consider, despite having the 1D RSI make a rebound from oversold levels and a bottom formation similar to early October, mid-May and early March 2021.
The 1D MA200 (orange trend-line) is the first natural Resistance. If the price gets rejected at the top of the Channel Down (Lower Highs trend-line), we'll have a sell signal targeting the Lower Lows trend-line.
On the other hand, a break above the Channel Down along with closing above the 1D MA50 (blue trend-line), will be a confirmation that the index has recovered the long-term bullish trend and will be a buy signal towards the Higher Highs trend-line with a rough technical target the 4.0 Fibonacci extension at 17515.
--------------------------------------------------------------------------------------------------------
** Please support this idea with your likes and comments, it is the best way to keep it relevant and support me. **
--------------------------------------------------------------------------------------------------------

NASDAQ 100 (NDX) WILL IT BOUNCE BACK?Futures opening slightly down at opening hours on Sunday night. Let's see if the price attempts a comeback towards the buy zone above 14680. Nevertheless, the price could get rejected at any time if a hard-selling wave occurs. Therefore, it's not time to be optimistic, but rather patient. Let's see what price tells us what to do. Keep a close eye on the key levels indicated by the green line.

Nasdaq 100: Investors buying the dipAfter the biggest correction since March 2020, investors are buying the dip on the main indices. Nasdaq 100 is the best US index in terms of long-term performance and drawdown. We are in oversold territory in all the main indicators such as the RSI, MACD... We are not safe yet, and a bigger correction may occur. If we lose the support line of this week (13700), we will see another -15%. Care with volume during uncertain times with the Russian-Ukraine crisis and the upcoming interest rates hikes.

NAS100 USD NQ1! NASDAQ 2022 JAN 31 week
NAS100 USD NQ1! NASDAQ 2022 JAN 31 week
Last week's short preference served us well again.
13706 was a previous high volume demand level,
resulting in an 800pt rotation currently.
2 scenarios may result
a) Market will take some time to absorb demand, and
then continue on its downtrend to test another
high demand area 12955
b) Demand comes in to support and re-accumulation
occurs, and market attempts to exit the current
downtrend.
This week's preference will be to adopt a
rotation play, i.e. entries will be made
at the edge of rotation boundary
Weekly = High volume bar closing off low, rejection of
lower prices = Strength
Daily = rotating between and14582 and 13706
H4: Some increase in bullish volume
Price reaction levels:
Short on Test and Reject | Long on Test and Accept
16767 16481
15992 15492
14582 14430
13706 12955
12465
Remember to Like and Follow if you find this useful.
Have a profitable trading week ahead.

Nasdaq 100 oversold at the February 2021 levelCan i call this the NDX 2022 bottom?
Nasdaq 100 is now at February 2021 top in an oversold area.
NASDAQ 100 Index P/E ratio is not low, 33.75, but lower than the same time one year ago: 38.75 ! The estimate is 23.89
My expectation from here is a rally to the $15150 support.
Looking forward to read your opinion about it.

Comparing NDX, SPX,DOW and RUT in post pandemic crashA comparison between NDX, SPX, DOW, and RUT in the post-pandemic crash clearly shows, Nasdaq and S&P 500 may soon follow the Small caps and enter Bear market !
Best,
Moshkelgosha
DISCLAIMER
I’m not a certified financial planner/advisor, a certified financial analyst, an economist, a CPA, an accountant, or a lawyer. I’m not a finance professional through formal education. The contents on this site are for informational purposes only and do not constitute financial, accounting, or legal advice. I can’t promise that the information shared on my posts is appropriate for you or anyone else. By using this site, you agree to hold me harmless from any ramifications, financial or otherwise, that occur to you as a result of acting on information found on this site.

NASDAQ Index Continue Lower | Daily, Weekly & Monthly: All REDI will be showing you three timeframes and very likely the last reminder before the major crash.
The NASDAQ-100 Index continues all RED, we start with the daily timeframe:
- On the chart above we have the NDX daily chart.
- We can see all the EMAs being broken as support.
- Extremely bearish indicators: MACD & RSI.
- Just today prices are moving below EMA300, Friday.
This can lead to a bearish weekly and monthly closes.
We continue with the weekly timeframe for the NDX:
- Weekly, we can see prices closing below EMA50 for the first time since February 2020.
- After the break below EMA50 back in 2020 a strong correction happened, something similar can repeat.
- We have a strongly bearish MACD.
- We also have a GAP/Window on the current candle opening price vs previous candle closing price.
Finally, this is the timeframe we looked at two days ago in a previous/related trade idea... The NASDAQ-100 (NDX) Index on the monthly timeframe, this one gives it away completely:
When we look at the monthly timeframe, we no longer go back to March 2020 COVID for the strongest correction, it goes back to 2008. We have a 50%+ correction (A -53.53% drop on the NDX).
Now, the current candle, January 2022, is the strongest bearish candle since September 2008 and it has other peculiarities.
Let's zoom in:
- We have a shooting star candlestick on Nov. '21.
- We have a Doji last monthly (Dec. '21).
- We have a full bearish breakdown this month (Jan. '22).
- The currently candle went through Junes 2021 candles real body on the downside. That's six month of growth removed in a few weeks.
All the timeframes agree.
The technical picture continues to be bearish.
Remember to share, follow, like & comment for more.
Thanks a lot for your continued support.
Namaste.

Nasdaq100 and my 3 bearish scenariosOf course, there is also the bullish, new ATH scenario, but this, in my opinion, is the less probable of them all.
So, after breaking under 15500 support, Nas100 fell strongly and reached my target at 14k (I went lower, but who counts). Now the index is in consolidation and loss digesting.
I consider 3 scenarios for down continuation:
1. Nasdaq will drop directly, without a retesting of FED day's high, and a break under 13500 low should accelerate losses towards the next important support at 12.5k
2. We will have a retest of the 14500 zone followed by the same drop to 12.5k
3. And this is less probable considering the selling pressure, Nasdaq will rise and test the broken support, now resistance, at 15500, of course, followed by the drop to 12500.
In conclusion, in my opinion, Nas100 will continue to the downside towards 12500
Best of luck!
Mihai Iacob

NASDAQRecounted NDQ and find it hard to imagine we fo not at least test the weekly ema 100, with the fact that yeilds are still heading to 2.1% USD is heading to $98-$99 & TA patterns show a failed bottom ST TL.. So probably we have a bearish Feb to start and bottom around 13,000

NASDAQ-100 Road Map AheadThe Nasdaq 100 index has come back down to test the key level at around 14,000 once again. Can we hold?
A consolidation below this area could indicate more upside. Watch out for a bearish breakout below 13,700.

The Nasdaq Long-Term (Potential For Major Crash | ~70%)When we look at the long-term chart for the NASDAQ Index (NDX), going back to 1985, we have only one major crash and that is between the year 2000 and 2003.
The NDX saw a 80%+ correction.
That is a drop of -83.49% in 944 days.
Here is the chart:
It took the index over 6,000 days to recover to its year 2000 All-Time High...
We believe a new correction will take place.
When we look closer at the monthly chart, multiple bearish signals we can appreciate...
Follow me:
1) We can see the TD Sequential printing a perfect 9, telling us that the market is overextended. In the next few sessions doubt start to crip in.
2) In October we have a full green candlestick. The candle that follows with a #2 is a shooting star, a bearish candle.
3) The next candle is a Doji, signaling indecision in the market...
4) This months current candle, we have a full red/bearish candle which is moving below EMA10. Another red candle and we have full breakdown confirmation. Only a close above the Doji's high can cancel this signal out.
At the same time, we have a MACD trending bearish with a young bullish cross:
We have bearish divergence on the RSI since January 2018... The NDX is getting ready to drop.
The monthly candle closes in 5 days at which point we either get a rejection or confirmation based on candlestick reading.
Closing below 14,750 would be strongly bearish for this index.
We expect a very strong crash throughout all markets unless something critical happens on the positive side in the next few months.
Remember to support me with your LIKES, share, comments and follow.
Namaste.

NASDAQ Breakout?We must hold the key level indicated by the green line in order to return back into the trend. As long as we trade below the green line, looks more and more like a bearish breakout.

NASDAQ - Bear run over?Pinbar in the daily chart is signaling a slow down of the downward trend with a potential up within the next days. Target 1 is the Resistance Area and Target 2 is the lower line of the Longterm Trend Channel. Don't forget to put your SL below the Support Zone in case you pick long now. Likely the Support Zone will be retested.
___________
🚀 Follow for daily posts
🎯 About my posts: They are kept self-explanatory in order to avoid overcomplicating and confusion. Mostly price signals and trend analysis combined with chart patterns.
Disclaimer: This is not an investment advice

Nasdaq100- A pull back can happen- good opportunity for shortLast week, after breaking under important 15500 support, I said that I expect Nas100 to fall to the 14k zone.
The drop happened very quickly and even exceeded my target with a low of around 13.500.
Now the index is in a normal recovery and this can provide bears a good opportunity to enter the market.
My sell zone is 14.500-15k and only a daily close above 15k would put a pause in this scenario
The first target can be yesterday's low.
Best of luck in shorting Nasdaq:)!
Mihai Iacob
