$SMH/$NAS100 is clearly in a bearish patternThe semiconductor sector was the poster child of the 2023 & 2024 bull market. The cap weighted index is a momentum play with heavy weights like NASDAQ:NVDA and NASDAQ:AVGO outperforming and hence the ETF gives more than 100% return in 2 years.
NASDAQ100 index is also cap weighted and momentum oriented. But the index provides diversification to a certain extent. NASDAQ:SMH hit an ATH in June 2024. In this chart we are plotting the ratio of NASDAQ:SMH vs $NAS100. The ratio peaked in June 2024. The ratio is making new lower lows and lower highs.
If we plot the inverse head and shoulder, we see that the ratio can probably hit the neckline which lies at 0.01. This will indicate a 10% more downside in NASDAQ:SMH compared to $NAS100. Currently NASDAQ:SMH is at 226 $. This will indicate a low of 200 $ and then it might indicate a bounce back from those levels.
Consolidation of NASDAQ:SMH around 220 $ - 200 $.
NASDAQ 100 CFD

18 Times, +2000%, 5800 Days - All About NASDAQ100 Corrections!Hi, all!
I need to repost some of my recent ideas on TradingView due to issues with the platform's moderation. Let's start! The most up-to-date post is coming right away - one that serves as a timely reminder during these interesting times: never forget history.
From November 2008 to February 2025, the Nasdaq 100 (NDX) index has grown by over 2000%! Yes, that’s a 20x increase! This tech giant, made up of the 100 leading technology stocks, has shown impressive strength.
For comparison, the S&P 500 has risen about 820% in the same period. A great performance but Nasdaq 100 leaves it far behind.
Has this been a straight-line rise? Not really. Looking back, it may seem like the perfect investment. But the road was not smooth. Nasdaq 100’s success came with painful drops, investor panic, and moments when it felt like the market would never recover.
From the outside, everything looks great. But would you sit through a 30% drop, while the news is screaming about the "end of the world"?
So, I decided to analyze every correction of 10% or more since the market bottom in 2008.
- How long do corrections and recoveries last?
- How often do they happen?
- What should investors know?
- Can this help you in any way?
DATA ANALYSIS - 18 corrections in Nasdaq 100 (2008–2025), -10% or more.
Retracement Stats:
- Average drop: -15%
- Median drop: -13%
- Biggest drop: -37.72%
- Smallest drop: -10%
Correction Length (17 completed corrections): How many days does a correction last from the peak to the bottom?
- Average: 60 days
- Median: 35 days
- Longest: 325 days
- Shortest: 14 days
Recovery Time: From bottom back to new highs.
- Average: 165 days (~5.5 months)
- Median: 119 days (~4 months)
- Longest: 752 days (over 2 years)
- Shortest: 42 days (~1.5 months)
Correction Frequency
If we take a rough estimate, in 5800 days, there were 18 corrections, which means a correction happens every 322 days (~10.5 months) on average.
Total Time Spent in Corrections vs. Rising Markets
- Corrections lasted 1016 days
- Recoveries lasted 2801 days
- Total time spent in "work mode": 3817 days
- Total "smooth uptrend" days: 1983 days (~5.4 years)
Basically, like a hardworking employee – the market spends more time struggling than rising!
What Can Investors Learn from This?
1. Accept Volatility
Knowing that market swings are normal, investors can keep a long-term perspective and avoid panic-selling during downturns.
2. Nasdaq 100 Has Always Recovered
In the long run, Nasdaq 100 has always bounced back to new highs. Each recovery has been different, but so far, making new all-time highs has never been a problem.
3. Make Better Decisions
Understanding psychological biases helps investors make rational choices and manage risks better.
4. Market Drops = Opportunities, Not Threats
Most big market rallies started when most investors were too scared to buy.
"A simple rule dictates my buying: Be fearful when others are greedy, and be greedy when others are fearful." – Warren Buffett
Market drops always feel unique and scary but history shows they follow repeating patterns. And those who keep their emotions in check have the best opportunities.
"The time to buy is when there's blood in the streets." – Baron Rothschild
Final Thoughts: Is the current retracement a buying opportunity? No one knows for sure but history suggests - stay calm!
So, that's all. Like & Boost if you find this useful! 🚀
Have great day,
Vaido
💬 Before you leave... What’s your take on the current Nasdaq 100 correction? Drop your thoughts in the comments 👇
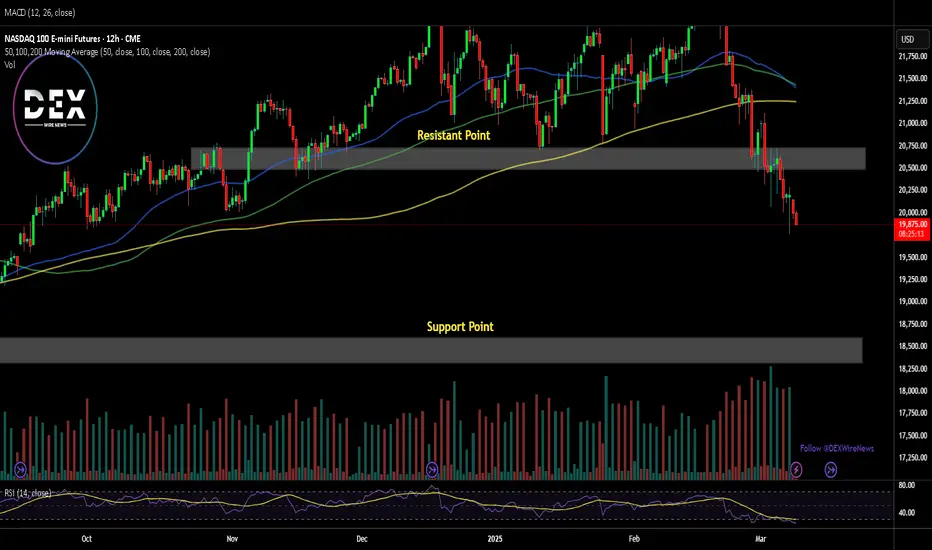
NASDAQ Futures Fall Following S&P's Worst Week Since SeptemberUS stock futures fell solidly Monday as investors and traders took the weekend to process the February jobs report and prepared for a busy week of economic data, headlined by a report on inflation amid concerns over its resurgence under President Trump's unpredictable trade policy.
Dow Jones Industrial Average futures (YM=F) fell 1%, while futures attached to the benchmark S&P 500 (ES=F) also dropped 1% after the index posted its worst week since September. Futures tied to the Nasdaq (NQ=F) also slipped around 1.79%.
All three major indexes looked set to build on losses of more than 2% last week.
For the Nasdaq Composite, the resistance point has been faded with selling pressure increasing, the 18,500 point could serve as support point for Nasdaq price index. However, should a trend reversal occur, the break above the resistant pivot may catalyse a bullish spree as industries, investors and traders are dissecting President Trump's trade policy.
Nasdaq market analysis: 10-Mar-2025Good morning! Happy New Week! Happy New Day ! Here's your daily Nasdaq market analysis. Learn, grow, and trade wisely.

QQQ - NASDAQ Has Never Been This ExpensiveQQQ relative to money supply reveals that markets have never been this expensive in history, despite all the money that was pumped in over covid.
Tulips!
Caution is in order despite what "experts" may tell you.

Actionable Nasdaq insights: 05-Mar-2025Rise and shine, traders! Start your day with actionable Nasdaq insights. Let's grow your skills together, one chart at a time.

Nasdaq market analysis: 26-Feb-2025Good morning! Here's your daily Nasdaq market analysis. Learn, grow, and trade wisely.

TP FILLED ON NASDAQMinutes ago, I posted to sell NASDAQ targeting the 4H LQ, and the market filled our target.
Follow for more!

SELL NASDAQToday we entered in a bearish position on NASDAQ in which we're trgeting the 4H LQ
I don't post at the same time we enter since I share it to my students.
Follow for more!

Nasdaq market analysis: 25-Feb-2025Let’s dive into today's Nasdaq market analysis. Share insights, and potentially spot opportunities for good pips.

Nasdaq market analysis: 24-Feb-2025Let’s dive into today's Nasdaq market analysis. Share insights, and potentially spot opportunities for good pips.

OUR TRADE TODAY ON NASDAQToday again we caught another good trade on NASDAQ which was based on the DOR and FVG, and our target was the Liquidity.
PS: THE ENTRY SCREENSHOT WAS TAKEN ON THE 1 MIN CHART!!
Follow for more!

Nasdaq market analysis: 13-Feb-2025Good morning, traders! Welcome to today's Nasdaq market analysis. Compare my price action insights with your own charts and enhance your trading skills.

Nasdaq market analysis: 11-Feb-2025Good morning. Welcome to today's Nasdaq market analysis and educational insights for price action traders.

NASDAQ ShortBased on the previous analysis, I am still bearish biased and my entry might be based around the 4H Order / Breaker lock at around 21730.
If it respects it, then we will be on a bearish run. If not, we might look for a buy setup towards the All Time High

Nasdaq market analysis: 10-Feb-2025Good morning Dear Traders! Join me for the first Nasdaq market analysis for the week. Share your charts, ask questions, and let's discuss trading strategies.

Nasdaq market analysisGood morning Dear Traders! Join me for the last Nasdaq market analysis for the week. Share your charts, ask questions, and let's discuss trading strategies.

AMD'S TLs and Channel101 Basic trend lines and channels analysis. Red lines are still holding and green channel is holding thus far.

Nasdaq market analysis: 06-Feb-2025Good morning Dear Traders! Join me for Nasdaq market analysis. Share your charts, ask questions, and let's discuss trading strategies.

Food for thought NETR vs NDXThis chart is the NETR (Nasdaq equal weight 100 vs NDX (Nasdaq 100). Not bullish or bearish but something to look at.

Nasdaq insights: 05-Feb-2025Good morning, traders! As a seasoned price action trader, I'll share my Nasdaq insights to help you improve your trading skills.

Nasdaq analysis: 04-Feb-2025Good morning, trading community! Today's Nasdaq analysis is for you. Share your thoughts, ask questions, and let me help you grow.

Nasdaq market analysis: 03-Feb-2025Good morning! Happy New Week! Happy New Month! Here's your daily Nasdaq market analysis. Learn, grow, and trade wisely.
