Nasdaq analysis From yesterdays analysis here is a little update. The trade is going as planned and we have broke out to the downside. our next target will be 13550 the first pullback before continuing up. However if the market decide to go further down for a deeper pullback then we may see price go down even further to 13409 before continuing up.
NASDAQ 100 CFD

NIONio is forming text book EW ABC
correction after large impulsive move I would estimate the last 5 wave are actually part of a larger wave 1 and
the ABC correction is the larger wave 2 pull back and after NIO finds a bottom
we will push up for Wave 3 of the larger wave heading for $137 or the 1.618 fib extension.

NASDAQ100- Analysis We look like we have a double top formed and I do expect the price to drop a little before going back up.If this double top is valid and it breaks out the triangle then price will drop to 13551 before continuing back up. However price can easily break this triangle up and just continue going up. our next target for the bulls is 13921.

NASDAQ Analysis We had a great Bullish Rally yesterday, A lot of you guys took the trade from the last analysis. Today we may see some pullbacks before continuing. A pullback to 13550 before the bulls carry on going to 13793-13922. However there is also a good chance we can break the current trend and carry on going up to our buy targets.
Those interested in Signals see details below to get in touch.

#Nasdaq - Fibonacci Levels for Support and ResistanceNasdaq looks bullish
1. Treasury yields going down, inflation worry is overblown
2. China cracking down on commodity hoarders causing Iron ore index to fall heavily.
3.Nasdaq Volatility Index VOLQ has a downtrend, which is looking go down.
Happy Trading, but still in correction, hence next move is still going to be little volatile.

NASDAQ Analysis Hi Guys hope you all had a great weekend.
Last week nasdaq we had some good bullish rally then came back to retest the trend line and now has started to continue. Good S/R and Trendlines can never go wrong. Market respects that's a lot and this is one of the key indicators for us to see where the market is coming next to getting this right is so important.
Today we may see the bulls take the price to 13793-13922. However if the price does come back and close below 13400 there is still good chance for the bears to come in pushing price down to 13170 and below.
Trade safe, use the correct lot sizes and have good risk managements in place.
Problem is not trades hitting stop loss, but the losses are more than the account can handle.

A-shares are the most valuable mainstream assetsHere is a chart comparing the Nasdaq 100, Bitcoin, and the Shanghai Index, which is in a position to break out of its long-term downtrend line on a weekly basis. Once this long - term downtrend line breaks, it opens up a lot of upside.
The Nasdaq and Bitcoin have proven this logic in time.
Given the current state of global financial markets, the Fed's decision to let loose cannot last long, as we saw firsthand in 2008. The United States tried to shift the crisis with the SDRs of the dollar, but it did not work well for China. Because China has enough digestive capacity, complete industrial structure, and at the same time, China is the country with the best epidemic control. In a mechanism that can mobilize resources and allocate assets to a high degree, the ability to deal with crises is naturally strong.
If the US fails to avert the crisis, it may eventually catch fire, so the US financial market is in crisis, which is why Wall Street has not given up on the Chinese market, and more foreign investment is flowing to China, which is also confirmed.
As an emerging financial market, digital currency has made considerable development in the past two years, but its stability is very poor, let alone risk aversion. It is itself the greatest danger. A market that is threatened by policy and manipulated by individuals cannot become the first choice for mainstream money, if it does not collapse. While many of Wall Street's biggest firms are now playing the game, that doesn't mean the digital currency market is ready to compete with traditional financial markets. TULIPS, too, nearly upended European financial markets, but in the end they were nothing more than a fleeting event.
The future of digital currency is uncertain, but for now, at least, it won't be banned as a commodity by the government, but they could be suicidal if they try to touch the currency space. But as a commodity associated with crude oil, non-ferrous metals and gold, it is certainly not the original intention of the players behind Bitcoin, so the market is full of uncertainty.
Back to A shares, whether fundamentals, or technical, are full of temptation. First of all, the valuation of A-shares is still very low, while the quality of China's listed companies is constantly improving, and the entry of foreign capital brings fresh water, and also accelerates the standard governance. When the epidemic is uncertain, China is certainly the safest market, so the stock market, as an economic barometer, should feel the market changes the quickest.
From the technical analysis, this trend line once broken, A shares will open 5-10 years of slow bull trend. As for investment options, I'm a long-term believer in new energy and biomedicine.

Nasdaq analysis Hi Guys, We had a beautiful rally yesterday pushing the price up to 13517 one of our key resistance area. So far the market has followed by previous analysis very nicely. But today I would be precautious. Will this rally continue or will we see bears come in today. For the bulls our target will be 13664-13921 and for the bears anywhere between 13300-13041.
On the lower timeframe we can see the market is consolidating and even formed a triangle. I would wait for a break of the consolidation before taking any trades. Be ready for either the bulls or the bears.

NASDAQ - Elliott Wave CorrectionStill on the bullish side, reasons given on the chart.
NASDAQ:VOLQ
- Happy Trading, beware of Correction, no one can tell where it's heading to, although I'm biased towards bullish because of VOLQ - Nasdaq volatility index.

NAS100 Analysis Hi Guys, Yesterday was a very shaky day, we had a attempt to downside if we look at the day chart we can see it failed to break. It was always going up but we had a pullback before continuing. Today I expect to see buys anywhere between 13540-13792. Be careful again of the New York opening where we can expect fake out etc.

NASDAQ - Elliott Wave Correction Nasdaq looks strong.
Key points -
Biggest reason is volatility index for Nasdaq is showing weakness, when Nasdaq was going down, there was not enough strength in VOLQ, that means buyers were buying every dip today.
NASDAQ:VOLQ
PS: Corrections are hard to analyze as they can take any turn, I'm bullish but still conservative.
Happy Trading.

Nasdaq Analysis Last week we had some good fall and this week I'm expecting the rise of nasdaq again. Im expecting NAS to go back up to it strong resistance area of 13792. However if the market does decide to come down and break through 13297 then we may see some more sells before the buyers come in- sell to watch out for 13169-12900.
On the daily I highlighted where im expecting the market to go.

S&P Fast Recovery Can it Continue?S&P500 has seen a quick recovery after last week's sharp sell-off. We're currently facing some resistance right now. Will the bullish momentum continue?

QQQ most likely to test 332 and then decide the direction QQQ Weekly chart looks still bit weak. Friday's action saved it from meltdown. Thursday's bounce from long term trend line (more evident on NQ Futures) was big saver. Going forward, QQQ needs to close above 332 to push bears to sideline. If close below 322.80, would be big red flag as it may start weeks of downside action. Must hold trend line support in any case. Chart shows two possible paths it can take from here.

NASDAQ Buy SignalPattern: Channel Up on 1D.
Signal: Buy as the price rebounded (almost) on the 4H MA300 (yellow trend-line), which last time (March 05) formed a bottom. Also the 1D RSI hit the Support Zone that has been in effect for a year.
Target: 14400 (slightly below the 1.382 Fibonacci extension).
P.S. A long-term possibility on Nasdaq:
** Please support this idea with your likes and comments, it is the best way to keep it relevant and support me. **
--------------------------------------------------------------------------------------------------------
!! Donations via TradingView coins also help me a great deal at posting more free trading content and signals here !!
🎉 👍 Shout-out to TradingShot's 💰 top TradingView Coin donor 💰 this week ==> xBTala
--------------------------------------------------------------------------------------------------------

Nas100 Analysis Nas has been playing beautifully with the support and resistance areas respecting the higher timeframe trend lines. I have had many messages with people who have taken the trades from analysis and saw some amazing results. and yes it is as simple as that. Today I feel we will have some more bears, a bounce of 13297 will bring us down to 13042- 12776. However if we do break through 13297 I would wait for 13409 before taking a long trades to give me the signal that its clear for the bulls to come in. We should always look at higher timeframes just to understand what is happening in the market.


NAS100 - Will the long term support hold?Looking at NAS on the daily, price is approaching a trend line that has been well respected over the past year, along with RSI reaching towards the oversold territory, and the MACD already deep under; from a technical perspective, 12950/13000 could be a great price to enter a long position for a medium term trade. However, the key fundamental factor driving NAS lower recently (inflation fears - and rightfully too) should certainly be a cause for concern and could continue to push NAS lower to some key areas (12700 / 12200 / 11000 - maybe a little exaggeration here).
How deep is the first support?Those who have early access to my trading ideas have the chance to perform better.
Don't you believe it?
Check my recently private post:
I have lots of technical and fundamental reasons that this correction will be different and is going to be more than 10%, you will see the technical reasons in my charts. Let’s review the fundamentals:
1- The most important factor is limiting margin for hedge funds by banks, after Archegos capital management phenomenon..!
2- The Buffett Indicator was at elevated levels before the dotcom crash of 2000 to 2002, and before the financial crisis of 2008, but at respective values of 137% and 105%, lower than today's reading of 157%.(Stansberry research)
3- Americans are now holding more money in stocks than ever before... and that includes the peak of the dot-com bubble.The data is from JPMorgan Chase and the Federal Reserve. It includes any stock that folks may hold in 401(k) accounts as well.
Right now, 41% of our financial assets are allocated to stocks. Again, that's higher than the dot-com peak of 37%.
4- Constant money out flux since early 2021 which decreases the trading value in more than 95% of stocks!
5-Margin debt stands at $822 billion – an increase of more than 25% since September of last year.(Stansberry research)
Conclusion: Any factor that limits new money influx will have negative effects on markets, and Bubbles always burst when they have their biggest size!
To protect your capital:
*Use tight stop loss even for your long-term investments.
** Hedge your positions using inverse ETFs like SQQQ, SPXU,…
*** Always accept the loss when it is small, if it becomes bigger it will become harder to accept!
The above charts: show Nasdaq/ Gold
Below charts: show Nasdaq
Can we use Nasdaq/ Gold ratio as a prospective indicator of a market top?
If we are looking at the 2 previous major market top (just before the crash happened) in 2000 and 2007, we easily can see in 2000 the market top and the Nasdaq/ Gold top happened at the very same time. Moreover, in 2007, market Top happened in late October 2007 however Nasdaq/ Gold ratio top happened in mid-July, almost 2 and half months earlier..!
Now we can see why gold is called safe heaven, and we should monitor its price movement in the coming days.
Moshkelgosha
If you are interested to have early access to my trading ideas, check the signature box below the post for more information.

NASDAQ Analysis Nas had a nice rally down and those who followed my previous post made some good profits. Thank you for the screenshots great work.
Looking at the higher timeframe we had some rejection from our trend line which may cause the price to carry on moving up. For the bears to continue I will be looking for a break of 13168 which will carry the price down to 13041-12775. A break of 13409 we will see the bulls come in and push the price back up to 13793 and further.

Last leg up on Nasdaq 100?Looks like we have completed the expanding flat correction for Minor wave 4 and have now started Minor wave 5 to complete Minor, Primary and Cycle wave 5. Very substantial correction expected after this last move up.

NASDAQThinking the NDX has been leading the dump and the DJIA & SP500 will dump harder % wise while NDX starts to lead the recovery IMO

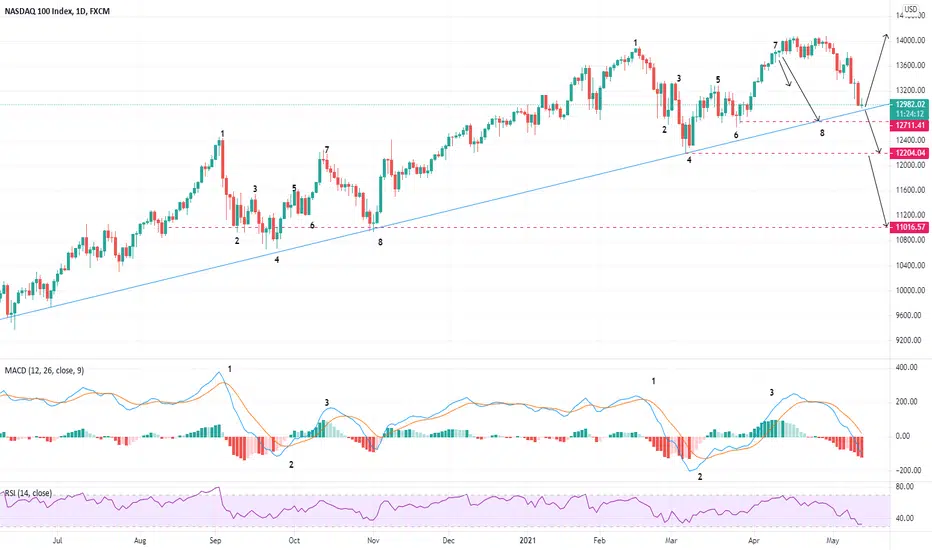
NASDAQ - Elliott Wave CorrectionShort Term Bearish to complete the 5th wave of ABC correction.
- Happy Trading.
