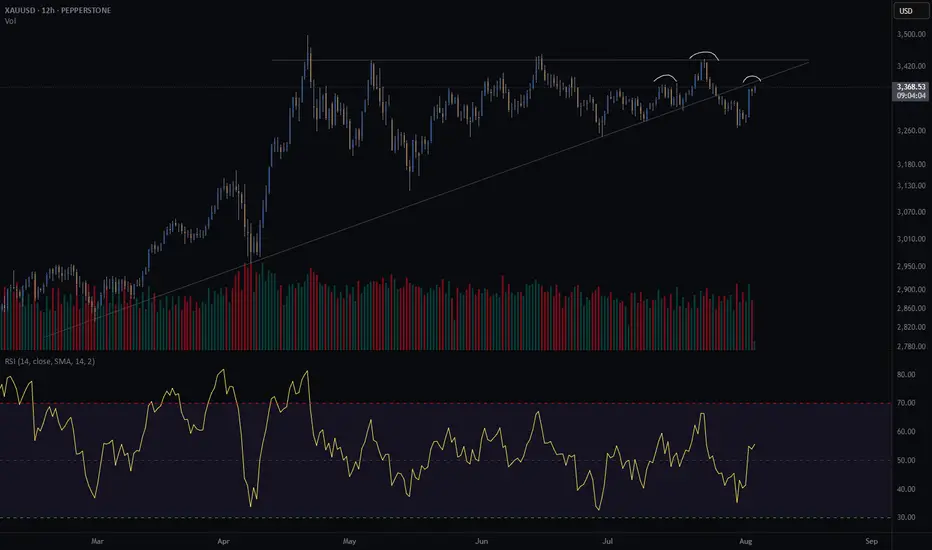
Gold crash (SHORT) - head and shouldersGold is at an interesting crossroad.
It broke through its diagonal support on Friday the 25th of July.
Price is retesting previous support. Does it turn into resistance?
Further confluence is a head and shoulders of the H8 and H12, with the right shoulder coinciding with the retest of the diagonal.
Since I am long gold with my investments, I am hesitant to short gold through my trading business. However, if my pattern is available, I take the trade. This will be a very short term trade - a few days at most if the trade goes in my favour.
Risk/reward = 12.6
Entry price = 3382.5
Stop loss price = 3396.2
Take profit level 1 (50%) = 3230
Take profit level 2 (50%) = 3181
The risk reward is exceptionally high. However, I have taken a more conservative approach with my entry because of my apprehension to short gold. For this trade I will enter at the extreme end of the range in which I will look for entries. This is the reason for such a high RR. It might result in me missing an entry.
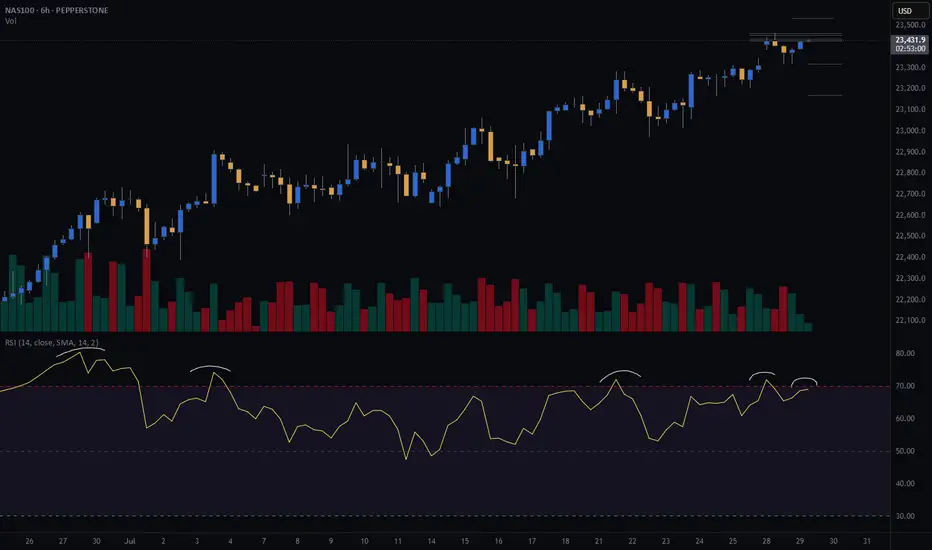
Ndxcrash
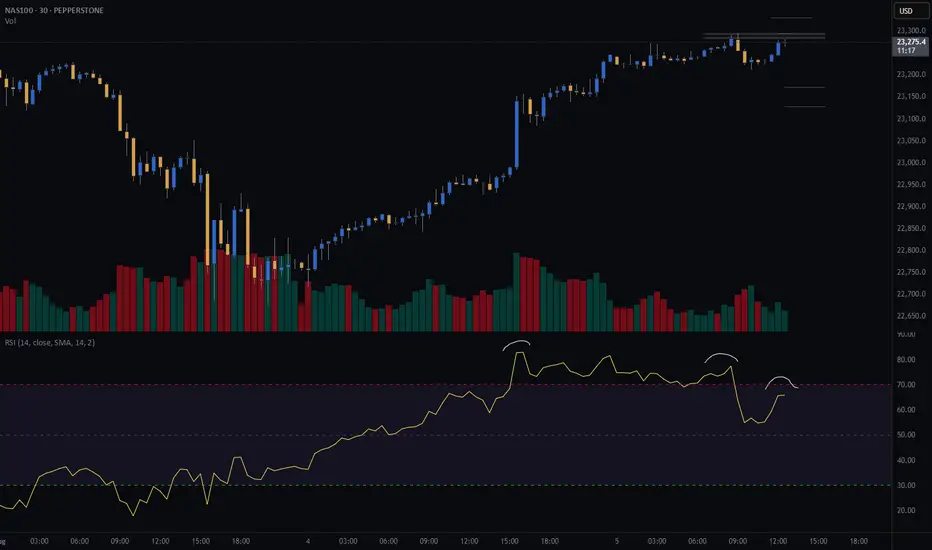
NAS100 (CASH100) Short - Double top 30minThe 15min head and shoulders setup got invalidated.
However, my double top variables are currently being met.
Still need confirmation before entering trade.
Risk/reward = 2.7
Entry price = 23 284
Stop loss price = 23 331
Take profit level 1 (50%) = 23 173
Take profit level 2 (50%) = 23 129
What does everyone thing the NASDAQ is going to do today?
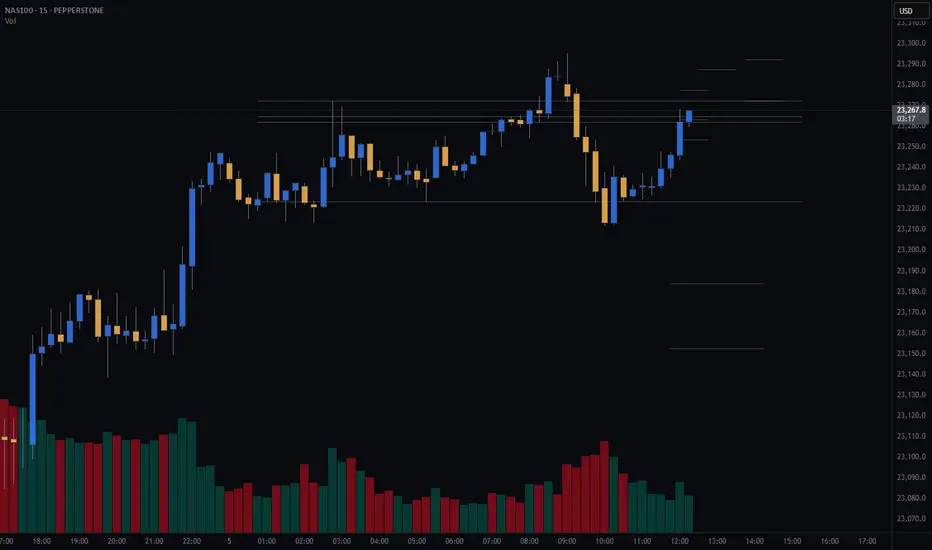
NASDAQ (CASH100) SHORT - head and shoulders 15minPotential short on nas100 (cash100) with head and shoulders on the 15min.
Still waiting for confirmation on some of my variables before I enter.
Risk/reward = 3.3
Entry price = 23 262
Stop loss price = 23 287.3
Take profit level 1 (50%) = 23 184
Take profit level 2 (50%) = 23 153
What do you guys and girls think the nasdaq is going to do?
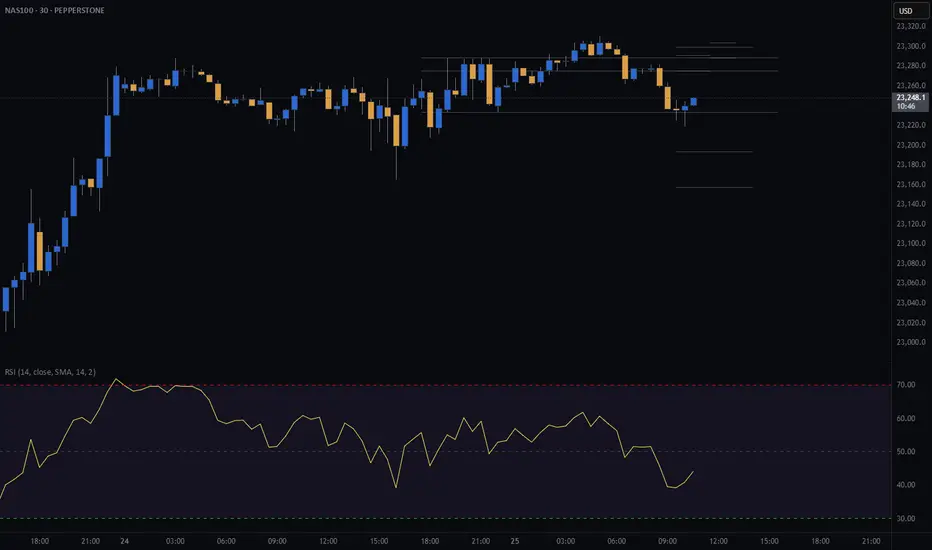
CASH100 (NASDAQ) CRASH - Head and shoulders Risk/reward = 3.7
Entry price = 23 430
Stop loss price = 23 503.2
Take profit level 1 (50%) = 23 202
Take profit level 2 (50%) = 23 099
Still waiting for some variables to confirm before entering the trade
NASDAQ (CASH100) SHORT - Double top H6Risk/reward = 4
Entry price = 23 463.1
Stop loss price = 23 534.2
Take profit level 1 (50%) = 23 169
Take profit level 2 (50%) = 23 169
All variables met. Now just need price to reach entry level and close back within range.
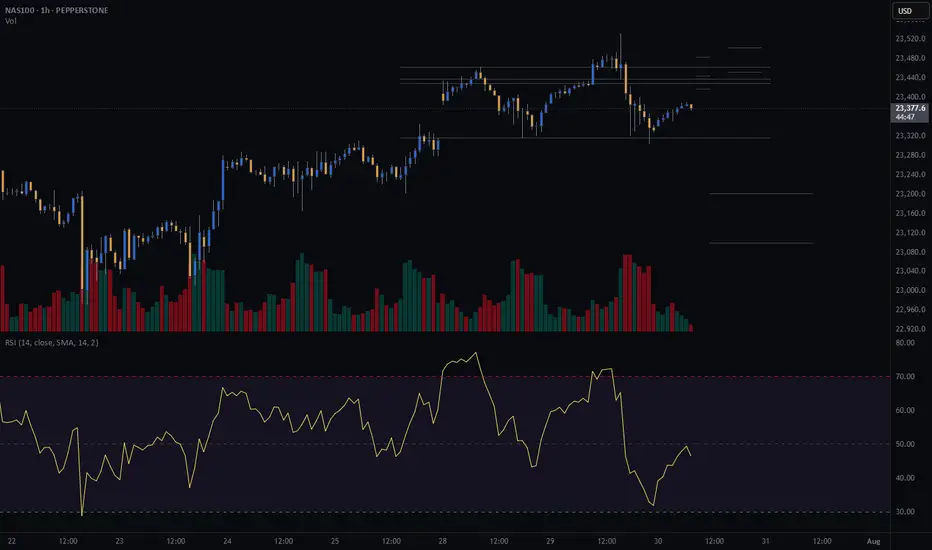
NDX (NASDAQ) CASH500 SHORT - Head and shoulders 30minRisk/reward = 3.2
Entry price = 23 275.7
Stop loss price = 23 303.9
Take profit level 1 (50%) = 23 193
Take profit level 2 (50%) = 23 157
Waiting on confirmation on a number of variables before entering the trade.
NASDAQ Analysis scenarios ideaWe can see 2 Gaps in the Nasdaq, with USA Elections ahead i expect volatility.
I think we will close the 19800 gap first, then 19600 for then going up.
It depends a lot in the USA elections results
Always do your research

NASDAQ100 Plummets! Short Trade Nears Final Target!NASDAQ100 (NDX) Analysis:
NASDAQ100 (NDX) has seen a strong downward trend on the 15-minute chart, with the trade setup delivering impressive results. Targets 1 through 3 have been hit, and the price is closing in on the final TP4 level, making this an ideal short trade for traders leveraging the momentum.
Trade Summary:
Entry Level: 20429.42
Target Levels:
TP1: 20323.94 ✅
TP2: 20153.26 ✅
TP3: 19982.58 ✅
TP4: 19877.10 (nearly hit)
Stop Loss: 20514.76
The Risological Dotted Trendline guided traders perfectly through this short trade, marking a strong resistance level as the index continued its descent.

NASDAQ 100 Sinks on AI Cost Woes - Full Target Breakthrough HIT!NASDAQ 100 (NDX) Analysis using Risological Swing Trader:
In the 15-minute timeframe, NASDAQ 100 (NDX) demonstrated a powerful bearish move, with all targeted profit levels being achieved in a swift drop. This short trade setup showed significant follow-through as investor sentiment shifted negatively due to concerns over escalating AI expenses reported by Wall Street's megacaps.
Key Highlights:
Entry Level: 20,429.42
Target Levels:
TP1: 20,323.94
TP2: 20,153.26
TP3: 19,982.58
TP4: 19,877.10
Stop Loss: 20,514.76
Context:
This bearish momentum aligns with Wall Street’s close on a lower note as major tech giants highlighted rising costs linked to AI developments. The day's range fluctuated between 19,880.26 and 20,227.19, underscoring the volatility and risk aversion among investors. The setup capitalized effectively on this negative sentiment, reinforcing the bearish outlook.
Summary:
This trade on NASDAQ 100 hit all targets with precision, benefiting from the broader market's reaction to heightened cost pressures in the tech sector. This downward move underscores the impact of macroeconomic concerns on equity performance, particularly in high-cost sectors like AI.

Short the NasdaqWas charting TQQQ so will just use this chart. I am -2% on a small SQQQ position but adding here. Arguably a double top. If it gets out of that channel possible violent drop I dont want to have to catch. 50% position, will add if we go up. Stops at acceptable loss. Not advise.

US 100Stoch RSI getting very overbought. But the diagonal is missing the 5th. I think we have a push above 14,000-14,300 in some mini parabolic pump move then roll over into either Wave b or wave 2

Nasdaq Breakdown Analysis 11/04/2023Dear traders Nasdaq was down and after ny session it’s came Back and closed bullish so as you see in my chart I expect price if he reject 12997 and closed bullish it will be chance to buy and if he breks below 12997 and closed bearish it will be Chance to sell wait always for price action trade safe
Good luck

Reversal?Potential reversal identified based on August price action.
We are at a tipping point for tech.
Weekly technicals are oversold.
MACD monthly remains negative.
Jobs report and further Fed hikes may amplify this technical analysis may tip the scales and send tech plummeting.
Good luck,
Opinion - not financial advice

Bullish NASDAQ WOLFE WAVE SETUPThere is also a bullish wolfe wave setting up on the 4hr and 3D time-frames which all can be used for supporting evidence that a strong rally is nearing. The projected target is calculated by extending a linear line between pivot 1 and 4 and projecting the line. This is represented as the line perforated line, as shown in the chart. If we extend a vertical line from the apex to the perforated target line, the time and price meet on Nov 29, 2022 at 14400. This is a very aggressive time and price target; however, there is a gap open at $13225 and it will most likely fill this year, so I expect the midterm elections along with tax loss selling and christmas rally into january effect will all contribute to a strong rally. I hope the analysis serves you well and you remain on the right side of the market.

IXIC (NDX) Logarithmic Long Term Trend Line A long term trend line has been touched on the Nasdaq Composite
This has been seen as a point of great support extending all the way back to the 1980's
Price will likely bounce off this line and continue upwards
This is an addition to chart below, providing support

NDXWe have real momentum here on the NDX100. With the 3D sitting right on the 200 ema a break above that will likely confirm my count and send Tech sector (most likely crypto as well) up into higher targets on the HTF.

nasdaq updateIt's just x wave , don't enjoy it very much :-)
Another uptrend for 5th of terminal c and it will go down for new low

NDX JPMorgan: economic hurricane coming our way!Jamie Dimon, the JPMorgan Chase CEO:
"Right now it's kind of sunny, things are doing fine. Everyone thinks the Fed can handle this." "That hurricane is right out there down the road coming our way." "We just don't know if it's a minor one or Superstorm Sandy. You better brace yourself."
Jamie Dimon is predicting an economic "hurricane" caused by rising inflation , interest rate hikes and the war in Ukraine.
I have 2 scenarios: the most optimistic is that NDX formed and inverse head and shoulders chart pattern and it will close the year at the same level that it started it, around $16650.
And the worst case scenario is if Jamie Diamon is right and we are going lower after this bounce to the resistance.
In this case, the first strong support is $9750.
I see that it go lower only if oil stays higher than $140 - 150 for this year, then this is the strongest sign of a recession or if China invades Taiwan.
Looking forward to read your opinion about it.

NDX Collapse ScenarioUsing Fib circles to plot how price falls
Both corrections are around -80%
A fall like this allows for a third touch on the up channel that is apparent
Bars pattern placed (red) is just my thoughts of how price could act if this scenario occurs

Nasdaq100 inverse Head and Shoulders Chart PatternNasdaq 100 P/E ratio on May 12, 2022 was 20.71, which is below the Median of 26.59 or the Average of 30.04.
In the past 5 years, the Minimum was 15.74 on MAR 23 2020 and Maximum 86.30 on JUN 28 2017.
I have 2 scenarios:
1. Inverse head and shoulders chart pattern with a price target of $16650 by the end of the year.
2. Worst case scenario: bull trap at $13350 an retracement to the pre-pandemic level of $9750. I tend not to believe this scenario because of the too low price per earnings ratio of NDX.
Looking forward to read your opinion about it.

NDX Nasdaq100 Double Bottom If you haven`t seen my last NDX idea:
Then you should know that the double bottom is in and i think this was the last dip of 2022.
I`m expecting a return to $15250 level by the end of the summer.
Looking forward to read your opinion about it.

Nasdaq 100 closer to a double bottomIf you haven`t seen my last post about NDX:
Then you should know that Nasdaq 100 is closer to a double bottom chart pattern, with an upside potential reversal to $15670 this year.
Looking forward to read your opinion about it.

NDX Nasdaq double bottom ?NDX Nasdaq100 is looking bearish for now.
I think we might see a double bottom before closing higher this year.
Looking forward to read your opinion about it.
