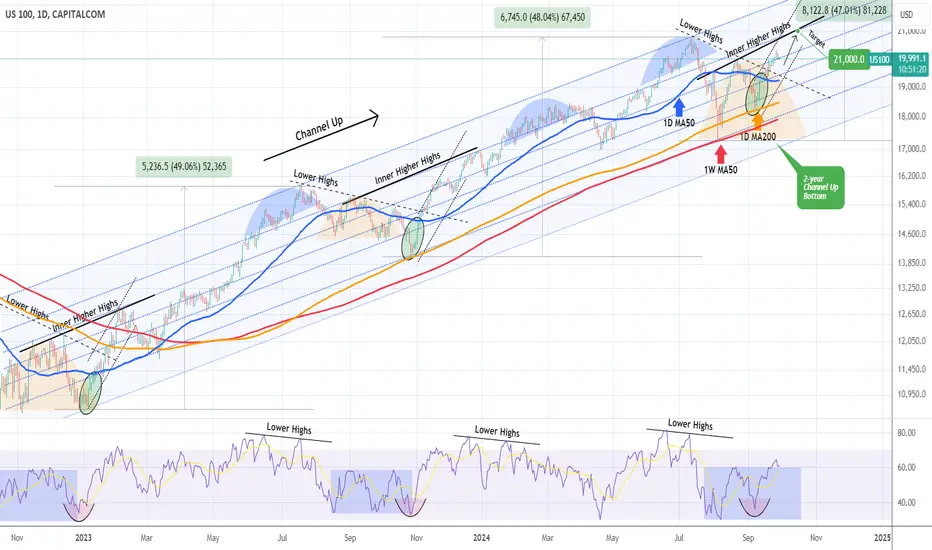
NASDAQ This rally isn't over yet.Three weeks ago (September 09, see chart below) we gave a very timely buy signal on Nasdaq (NDX), just after it touched its 1D MA200 (orange trend-line):
As you can see, the index started a relentless rally, breaking the August 22 High, and the Lower Highs trend-line in the process. We don't expect that Leg to be over yet. Based on the two previous Bullish Legs of the 2-year Channel Up, they first touched the Inner Higher Highs trend-line and then pulled back to the 1D MA50 (blue trend-line).
As a result, we expect a continuation of the upside with a short-term Target around 21000 and then after mid to end of October, pull-back towards the 1D MA50 going into the U.S. elections.
-------------------------------------------------------------------------------
** Please LIKE 👍, FOLLOW ✅, SHARE 🙌 and COMMENT ✍ if you enjoy this idea! Also share your ideas and charts in the comments section below! This is best way to keep it relevant, support us, keep the content here free and allow the idea to reach as many people as possible. **
-------------------------------------------------------------------------------
💸💸💸💸💸💸
👇 👇 👇 👇 👇 👇
Ndxsignals
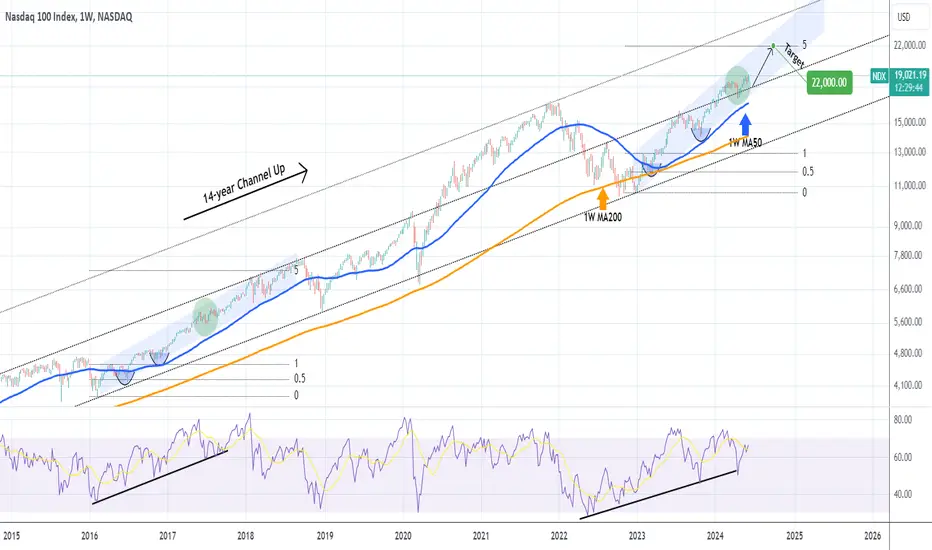
NASDAQ gave the best longterm bullish signal. Is 25300 possible?Nasdaq (NDX) confirmed the bounce on the 1D MA200 (orange trend-line) as argued on our previous analysis (September 09) and the rebound made the ultimate bullish break-out last week, as it crossed above the Lower Highs trend-line of the July 11 All Time High (ATH), giving us the most consistent long-term buy signal on a 2-year basis.
As you can see on this chart that goes as back as October 2022 and the bottom of the Inflation Crisis Bear Cycle, the two times that Nasdaq broke above such Lower Highs trend-line, while being above the 1D MA200, it gave the best buy signal possible, with both rallies peaking after a +49% and +48% rise respectively.
The Sine Waves have also confirmed early this month that the index bottomed and now we have the ultimate bullish break-out confirmation. The longer the 1D MA50 (blue trend-line) holds the better, but even if it breaks (April 2024), we still expect that we are on a similar Bullish Leg that should top in roughly the same way (+47% i.e. one percent less than the previous).
This gives us a long-term Target of 25300 for March - April 2025. We have plotted the Bullish Legs of 2023 and 2024 and as you can see, even though they diverge at times, they always converge again, forming a rough Channel Up, which can be a representation of our estimate course.
-------------------------------------------------------------------------------
** Please LIKE 👍, FOLLOW ✅, SHARE 🙌 and COMMENT ✍ if you enjoy this idea! Also share your ideas and charts in the comments section below! This is best way to keep it relevant, support us, keep the content here free and allow the idea to reach as many people as possible. **
-------------------------------------------------------------------------------
💸💸💸💸💸💸
👇 👇 👇 👇 👇 👇

NASDAQ The index is well supported to hit 25k by mid 2025.Last week (September 09, see chart below), we gave a strong buy signal on Nasdaq (NDX) right as the price was testing the 1D MA200, a strong Support on its 2-year Channel Up:
The index duly delivered and we've completed 5 straight green days already. Not only that but the 1D candle closing above the 1D MA50, practically confirmed the bullish extension into this week.
The current week however isn't just a typical one, as we anticipate the Fed Rate Decision on Wednesday and even though the expectations are fixed on at least a 0.25% cut, the volatility is expected to be high.
As a result, to filter out this short-term noise, we will resort today to the wider 1W time-frame, which helps keeping a more accurate long-term perspective. In fact it was the same chart we published 6 months ago (March 18, see chart below), which very accurately laid out the Support that you needed to calmly buy on the long-term, which as you can see, it has been a recurring signal since 2010:
Every time the price broke above a Resistance, it was the ultimate buy entry if re-tested later as a Support. That happened in mid April and that's what happened last week as well.
In fact, the index made a strong rejection on the 1.5 Channel Fibonacci level and then tested and held the 1W MA50, confirming the emergence of a Channel Up (orange) similar to June 2020 - November 2021. The 1W RSI similarities between the two fractals are also further evidence of this.
As a result, we expect Nasdaq to reach as high as 25000 by mid 2025 (a little lower than our previous 6-month estimate but still good enough to be an excellent buy opportunity even now).
-------------------------------------------------------------------------------
** Please LIKE 👍, FOLLOW ✅, SHARE 🙌 and COMMENT ✍ if you enjoy this idea! Also share your ideas and charts in the comments section below! This is best way to keep it relevant, support us, keep the content here free and allow the idea to reach as many people as possible. **
-------------------------------------------------------------------------------
💸💸💸💸💸💸
👇 👇 👇 👇 👇 👇

NASDAQ won't correct again in 2024It has been almost 1 year (October 24 2023, see chart below) when we called for a mega buy opportunity on Nasdaq's (NDX) last bottom:
As you can see, the index started an insane rally sequence right on that weekly candle and didn't correct again that much before the recent July - August 2024 pull-back.
The gains from that bottom buy signal have been almost +50% and as the 1W MA50 (blue trend-line) was tested on the early August Low and held, we expect Nasdaq to resume and maintain the steady bullish trend for the rest of the year.
The next Target before it gives a medium-term correction again in our opinion is 22500, which is exactly on the 1.618 Fibonacci extension from the October 2022 market bottom.
The reason we project this target is because, as you can see on our October 2023 analysis above, we find remarkable similarities between the 2022 Inflation Crisis correction and the 2008 Housing Crisis.
This is what helped us give the mega buy signal in October, because the price formed a 1W MA50/MA100 Bullish Cross, the first since February 2010 and the correction was contained above the 0.618 Fibonacci retracement level. So with the 1.236 Fib already achieved during the current (blue) Channel Up (see how both recovery sequences take place within Channel Up patterns), the next in line is the 1.618 Fib at 22500.
According to all the above, the next time that Nasdaq could correct might be early in 2025.
-------------------------------------------------------------------------------
** Please LIKE 👍, FOLLOW ✅, SHARE 🙌 and COMMENT ✍ if you enjoy this idea! Also share your ideas and charts in the comments section below! This is best way to keep it relevant, support us, keep the content here free and allow the idea to reach as many people as possible. **
-------------------------------------------------------------------------------
💸💸💸💸💸💸
👇 👇 👇 👇 👇 👇

NASDAQ Normal volatility. Bullish trend intact.Nasdaq (NDX) gave as the ultimate bottom signal on our buy call 2 weeks ago (see chart below) and staged a massive recovery from July's correction:
Right now it tested and held the 1D MA50 (blue trend-line) as a Support, establishing the new demand zone. During the previous Bullish Legs of the nearly 2-year Channel Up, when the price action remained above the 1D MA50, Nasdaq extended to a new Higher High on that pattern.
We may face some minor volatility for max a week, as the index encountered during the first to Bullish Legs but we should soon test the Inner Higher Highs trend-line, which most likely will see us reach our first Target of 20900.
-------------------------------------------------------------------------------
** Please LIKE 👍, FOLLOW ✅, SHARE 🙌 and COMMENT ✍ if you enjoy this idea! Also share your ideas and charts in the comments section below! This is best way to keep it relevant, support us, keep the content here free and allow the idea to reach as many people as possible. **
-------------------------------------------------------------------------------
💸💸💸💸💸💸
👇 👇 👇 👇 👇 👇

NASDAQ Reality will again hit those betting against the market.10 months ago (October 06 2023, see chart below), we published an idea with a similar title, as following a standard technical 3-month correction, there was a growing bearish sentiment amidst market fear over a potential economic slowdown of the 2023 recovery:
As you can see none of the 'fears' prevailed and instead the index offered us the best buy opportunity at the time. The early August correction has been the best buy opportunity since then.
After a 3-week correction, quite aggressive for sure, Nasdaq (NDX) reached its 1W MA50 (blue trend-line) for the first time in almost 1.5 years and rebounded emphatically, making the strongest case possible that this Support level priced the new market bottom.
We made slight changes on this 10-month chart and we've set 2 new long-term targets: Target 1 at 23250 (the 0.236 Fibonacci level) and 27000 (top of the Channel Up).
We utilized the Fib symmetry of the previous Bull Phase, prior to the 2022 (inflation) correction and since Nasdaq is currently at 97 weeks (697 days) since its Bear Cycle bottom (October 10 2022), we could assume that proportionally, we are around November 02 2022, around the 0.382 Fib.
The 1W RSI just rebounded on the 5-year Symmetrical Support Zone that only breaks during Bear Phases and the 1W MACD is also posting a similar sequence to Nov 2022. Note that as long as the 1W MA50 holds, the index is technically on a long-term Bull Phase with the Green Ichimoku Cloud supporting within the 1W MA50 and MA100 (green trend-line). Technically, the index can rise up to 29000 - 30000 before entering a new 1-year Bear Phase.
-------------------------------------------------------------------------------
** Please LIKE 👍, FOLLOW ✅, SHARE 🙌 and COMMENT ✍ if you enjoy this idea! Also share your ideas and charts in the comments section below! This is best way to keep it relevant, support us, keep the content here free and allow the idea to reach as many people as possible. **
-------------------------------------------------------------------------------
💸💸💸💸💸💸
👇 👇 👇 👇 👇 👇

NASDAQ erased 3 months of gains. Is this a Bear Market?In early E.U. session today the Nasdaq futures (US100) reached a level that was last seen on April 25, essentially erasing market gains of more than 3 months! By doing so, it hit the 1W MA50 (blue trend-line) for the first time since the week of March 13 2023 (almost 17 months).
That is the strongest long-term Support for the index and technically what potentially separates a long-term rally from a long-term correction phase. What matters here is the 1W candle closing. As long as the weekly candles close above the 1W MA50, the long-term bullish trend is maintained.
Last time the index closed a week below the 1W MA50 was on January 17 2022, it extended the bleeding to the 1W MA100 (green trend-line). What confirmed the new Bear Cycle was the failure to close a 1W candle again above the 1W MA50, even though it broke 4 times (January 31 - April 04 2022).
Since Nasdaq's long-term pattern remains a Channel Up anyway (since the October 10 2022 market bottom), if it holds and keeps closing above the 1W MA50, we expect a new +47% Bullish Leg (the previous two have been +48% and +49% respectively), which gives a long-term Target at 25400.
If however the index closes below the 1W MA50, we expect at least a 1W MA100 test, giving a rough Sell Target at 15500 (could be a little higher though). Further selling and a potential new Bear Cycle, will be confirmed only by a failure to recover and close above the 1W MA50 again.
-------------------------------------------------------------------------------
** Please LIKE 👍, FOLLOW ✅, SHARE 🙌 and COMMENT ✍ if you enjoy this idea! Also share your ideas and charts in the comments section below! This is best way to keep it relevant, support us, keep the content here free and allow the idea to reach as many people as possible. **
-------------------------------------------------------------------------------
💸💸💸💸💸💸
👇 👇 👇 👇 👇 👇

NASDAQ Held the 1D MA50 and is rebounding.Nasdaq (NDX) almost hit the 1D MA50 (blue trend-line) on Friday and immediatelly rebounded yesterday, in anticipation of high cap earnings starting tonight with Tesla and Alphabet. The 1D MA50 has been intact as the major Support of the Channel Up pattern since May 06.
The previous two Bullish Legs rallied at least +10.37% before the next short-term pull-back, so we are setting a new Higher High (top of the Channel Up) Target on Nasdaq at 21450.
Notice also the harmonic occurrence of the bottoms (Higher Lows) of the Channel Up as highlighted by the Sine Waves.
-------------------------------------------------------------------------------
** Please LIKE 👍, FOLLOW ✅, SHARE 🙌 and COMMENT ✍ if you enjoy this idea! Also share your ideas and charts in the comments section below! This is best way to keep it relevant, support us, keep the content here free and allow the idea to reach as many people as possible. **
-------------------------------------------------------------------------------
💸💸💸💸💸💸
👇 👇 👇 👇 👇 👇

NASDAQ Minor correction expected. Where to buy?Nasdaq (NDX) has almost reached the top (Higher Highs trend-line) of the Channel Up pattern that started on the October 26 2023 bottom. The last Higher Low was made on April 19 2024 and ever since, a strong Bullish Leg in the form of a Channel Up (dotted), took the index above both the 1D MA50 (blue trend-line) and 4H MA200 (red trend-line).
Since the last Bullish Leg topped at around a +20.87% rise, we can assume that the price has entered a rejection zone. The only parameter left to confirm this, is for the 1D MACD to form a Bearish Cross. As you can see the two Bullish Legs are fairly similar so far in their price action.
With the late December 2023 - early January 2024 pull-back bottoming on the 4H MA200 exactly, we are expecting a symmetrical pull-back to that level again, where we will be looking to add more buys and target 20700 (top of the 8-month Channel Up).
-------------------------------------------------------------------------------
** Please LIKE 👍, FOLLOW ✅, SHARE 🙌 and COMMENT ✍ if you enjoy this idea! Also share your ideas and charts in the comments section below! This is best way to keep it relevant, support us, keep the content here free and allow the idea to reach as many people as possible. **
-------------------------------------------------------------------------------
💸💸💸💸💸💸
👇 👇 👇 👇 👇 👇

NASDAQ will continue to rise on this pattern repetition.Nasdaq (NDX) has been trading within a (blue) Channel Up since basically the market bottom of the inflation crisis in October 2022. On the bigger picture, this is the technical Bullish Leg of the 14-year Channel Up and is supported by the 1W MA50 (blue trend-line) since March 13 2023.
Based on the 1W RSI pattern, we have previously seen such Bullish Leg within the long-term Channel Up supported by the 1W MA50, back on the February 08 2016 bottom. As you can see on this 1W chart, both Bullish Legs (Channel Up patterns) made their first pull-back on the 0.5 Fibonacci retracement level. In June 2018, the previous fractal reached the 5.0 Fibonacci extension and shortly after, the index corrected aggressively back at the bottom of the 14-year Channel Up.
We expect Nasdaq to hit again the 5.0 Fib ext sooner or later but most likely before the year is over. This gives us a medium-term Target of 22000.
-------------------------------------------------------------------------------
** Please LIKE 👍, FOLLOW ✅, SHARE 🙌 and COMMENT ✍ if you enjoy this idea! Also share your ideas and charts in the comments section below! This is best way to keep it relevant, support us, keep the content here free and allow the idea to reach as many people as possible. **
-------------------------------------------------------------------------------
💸💸💸💸💸💸
👇 👇 👇 👇 👇 👇
NASDAQ Another 2 weeks of consolidation possibleNasdaq (NDX) made the bullish break-out that we largely expected as described on our previous idea (May 15, see chart below) and almost hit our 19100 Target:
Right now we see a short-term pull-back, which based on the November - December 2023 fractal (green ellipse), should be at worst a 2 week consolidation. The 1D RSI also shows that symmetrically we should be at a point similar to December 06 2023.
That fractal then rose for a Higher High on the 2.236 Fibonacci extension. As a result, our medium-term Target is now set at 19900 (just under the 2.236 Fib and top of the 1.5 year Channel Up).
-------------------------------------------------------------------------------
** Please LIKE 👍, FOLLOW ✅, SHARE 🙌 and COMMENT ✍ if you enjoy this idea! Also share your ideas and charts in the comments section below! This is best way to keep it relevant, support us, keep the content here free and allow the idea to reach as many people as possible. **
-------------------------------------------------------------------------------
💸💸💸💸💸💸
👇 👇 👇 👇 👇 👇

NASDAQ on the most important level that will determine the trendNasdaq (NDX) easily hit our 18000 Target, which we set 2 weeks ago (April 23, see chart below):
That was the top of the Channel Down and 0.786 Fibonacci retracement level. As mentioned this is an important Resistance level as during the previous correction of the 1.5 year Channel Up (which bottomed on October 26 2023), the 0.786 Fib was the level that rejected the first upside attempt (on September 01 2023).
As a result, we are willing to buy again only if the index closes a 1D candle above the 0.786 Fib, in which case we will target 19950 (the 2.0 Fibonacci extension). Until that happens, we have to consider the probability of a rejection on the 0.786 Fib stronger, thus turn bearish, targeting 17000 (just above Support 1). The risk is low on that trade as we will take the loss the moment a 1D candle gets closed above the 0.786 Fib.
-------------------------------------------------------------------------------
** Please LIKE 👍, FOLLOW ✅, SHARE 🙌 and COMMENT ✍ if you enjoy this idea! Also share your ideas and charts in the comments section below! This is best way to keep it relevant, support us, keep the content here free and allow the idea to reach as many people as possible. **
-------------------------------------------------------------------------------
💸💸💸💸💸💸
👇 👇 👇 👇 👇 👇

NASDAQ One final dip left before it bottoms?Nasdaq (NDX) started the week on a bearish not and is correcting the last 1W candle, only a few hours left before the Fed Rate Decision. This is fundamentally the game changer for stocks, any hint towards cuts in the near future should have a strong positive effect on the markets.
Technically though, the long-term Channel Up pattern that started on the December 2022 Low has a base bottom on the 1D MA200 (red trend-line) - 1W MA50 (blue trend-line) Zone. In fact, both corrections/ Bearish Legs of the pattern, hit at least the 0.382 Fibonacci retracement level before finding Support and reversing upwards.
The 0.382 Fib is currently at 16800, any negative remarks during Powell's press conference can quickly and effortlessly hit that level. Even the 1W RSI suggests that we might be on a Lower High similar to the week of October 09 2023.
Whatever the outcome, those are levels good enough to buy for the long-term as the upside potential is significant and our personal Target is 20500 (top of the Channel Up).
-------------------------------------------------------------------------------
** Please LIKE 👍, FOLLOW ✅, SHARE 🙌 and COMMENT ✍ if you enjoy this idea! Also share your ideas and charts in the comments section below! This is best way to keep it relevant, support us, keep the content here free and allow the idea to reach as many people as possible. **
-------------------------------------------------------------------------------
💸💸💸💸💸💸
👇 👇 👇 👇 👇 👇

NASDAQ Emphatically below its 1D MA50 after +5 months!Nasdaq (NDX) is on the pull-back process, a correction that we called on our March 12 idea (see chart below) when the index reached the top of its 1 year Channel Up:
Even as recently as last week (see chart below) we called for the ideal sell entry and set a 17500 Target:
As you can see, the index emphatically broke and closed below the 1D MA50 (blue trend-line) yesterday for the first time in more than 5 months (April 04 also closed below it but only marginally). That is technically as strong bearish break-out signal.
The idea now is that we want the index to hit the 1D MA100 (green trend-line), which has been intact since November 06 2023, see how the market reacts and then determine if that is a low or not. Technically if it replicates the August 18 2023 Low, we should be expecting a Low on the 0.3 Fibonacci retracement level at 17,150 at least, which also happens to be just above Support 1.
The decline on the Aug 18 2023 Low was of the -8.52% magnitude, so that gives us a 16900 downside limit. We don't expect the pull-back to go that low though this time. A fair bottom signal can be when the 1D RSI hits 35.00 or the bottom of its Channel Down, similar to what took place on August 18 2023.
-------------------------------------------------------------------------------
** Please LIKE 👍, FOLLOW ✅, SHARE 🙌 and COMMENT ✍ if you enjoy this idea! Also share your ideas and charts in the comments section below! This is best way to keep it relevant, support us, keep the content here free and allow the idea to reach as many people as possible. **
-------------------------------------------------------------------------------
💸💸💸💸💸💸
👇 👇 👇 👇 👇 👇
NDX / NAS100 long idea 17780 point is the point to be protected and the stop point. I still think bullish, target point 18400. long position can be taken with bullish confirmations or long can be taken from the region above 17300.

NASDAQ Will the 1D MA50 hold or break and start a correction?Nasdaq (NDX) marginally broke and closed a 1D candle below the 1D MA50 (blue trend-line) last week but quickly recovered on Friday and this week has established its price action above it. Still it is under Lower Highs following the March 21 Double Top.
It is a fact that the 1D MA50 hasn't been broken in 5 months (since November 03 2023) so last week is the first bearish sign after much time, but the quick recovery leaves a neutral, to say the least, tone. However, the (dashed) Channel Up is already broken downwards, so we will wait for a final bearish confirmation, with the condition being another 1D candle closing below the 1D MA50.
If that happens, we expect a Channel Down to emerge similar to July - October 2023. In that case, we will be looking on the short-term for a 1D MA100 (green trend-line) test, with a minimum Target at 17500.
-------------------------------------------------------------------------------
** Please LIKE 👍, FOLLOW ✅, SHARE 🙌 and COMMENT ✍ if you enjoy this idea! Also share your ideas and charts in the comments section below! This is best way to keep it relevant, support us, keep the content here free and allow the idea to reach as many people as possible. **
-------------------------------------------------------------------------------
💸💸💸💸💸💸
👇 👇 👇 👇 👇 👇

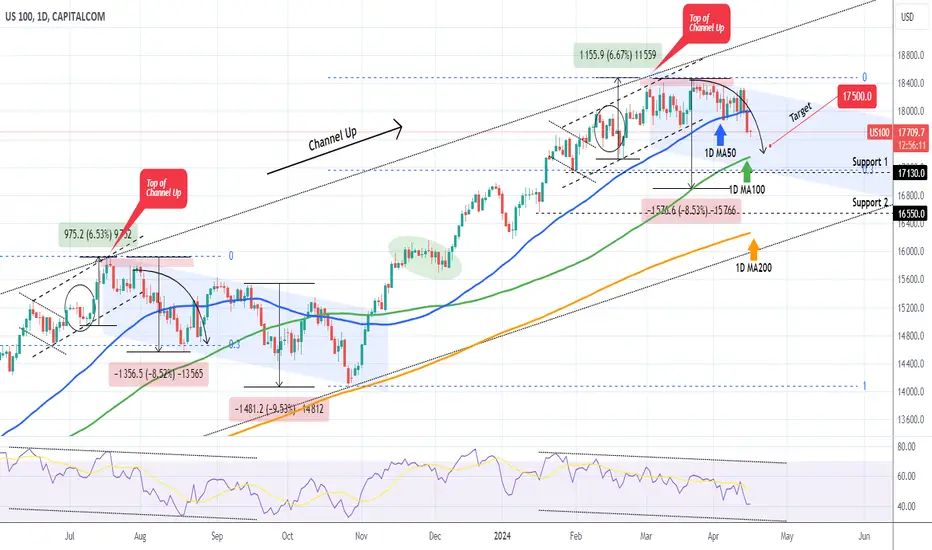
NASDAQ is very close to the top of the 1-year Channel Up! Sell?Nasdaq (NDX) is extending its aggressive rise of the Bullish Leg that started on the October 26 2023 Higher Low of the 1-year Channel Up and by the strength of it, it appears it will extend it to the max. That potential max extension is in the range of 18100 - 18300, which is the top of the dashed Channel Up and the top of the dotted 1-year Channel Up, which was initiated on the market Low of January 06 2023.
A news/ fundamentals based approach could time the bearish reversal after next Tuesday's U.S. CPI report. Technically though, the 1D RSI being on Lower Highs ever since December 19 2023, shows that technically we are already on a strong Bearish Divergence that can reverse any moment. The similarities with the previous Channel Up Higher High on July 18 2023 are striking, with the only exception that the current dashed Channel Up is overextending the 2nd peak.
Regardless of that, the 1D RSI is coming out a similar Megaphone and appears to be on a similar Lower High as July 31 2023. A similar RSI pull-back can be seen from February 02 to March 10 2023, which resulted into a -9.35% decline for Nasdaq. The August 18 2023 decline was translated into a -8.55% decline. As a result, assuming that 18100 is a potential peak for the index, we are targeting a minimum -8.55% decline, which falls directly on Support 2 at 16550. That would break the 1D MA50 (blue trend-line) and make contact with the 1D MA100 (green trend-line).
-------------------------------------------------------------------------------
** Please LIKE 👍, FOLLOW ✅, SHARE 🙌 and COMMENT ✍ if you enjoy this idea! Also share your ideas and charts in the comments section below! This is best way to keep it relevant, support us, keep the content here free and allow the idea to reach as many people as possible. **
-------------------------------------------------------------------------------
💸💸💸💸💸💸
👇 👇 👇 👇 👇 👇

NASDAQ 100 / 1H / TECHNICAL ANALYSIS NASDAQ:NDX I have indicated the completed targets of the ABCD pattern on the chart. Resistance is at 17670, and support is at 16248.
Please don't forget to like and follow. I'm sharing analysis exclusively for you. You can express your gratitude by liking and following

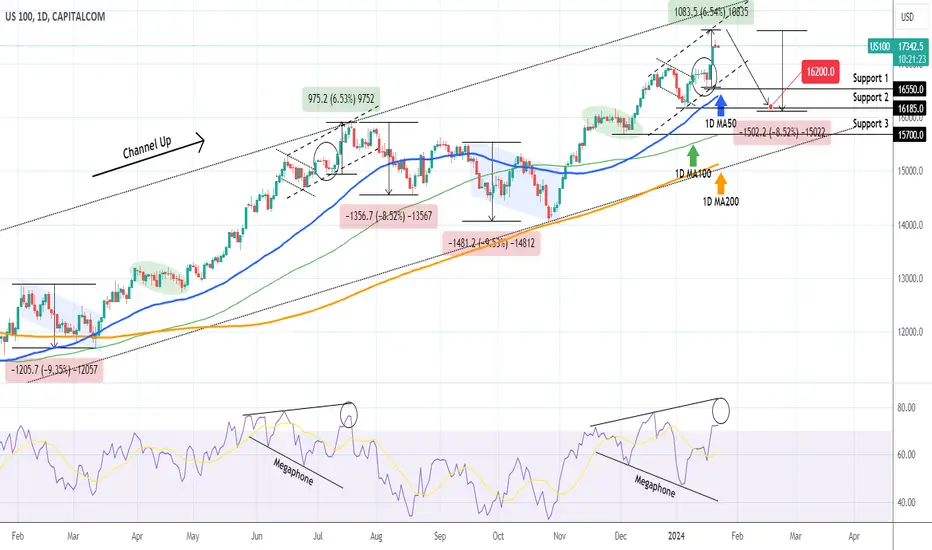
NASDAQ Extremely close to a peak and a correction.Nasdaq (NDX) closed yesterday on a red 1D candle, with the 1D RSI above the 70.00 overbought barrier, but remains within the (dashed) Channel Up, as well as supported by the 1D MA50 (blue trend-line) since November 03 2023.
Based on the 1D RSI which is within a Megaphone pattern, we might be approaching a peak similar to July 19 2023, whose RSI was also inside a Megaphone on almost the same levels as now. Following the peak, the price declined initially by -8.50%. Since the start of the year the other two major declines have been around -9.50%.
This suggests that if the index reverses around next week (Fed Rate Decision), we are technically aiming for 16200, which will put to a test Support 2 and the 1D MA100 (green trend-line), which made the bottom on the first -9.50% decline of last year on March 13.
The confirmation signal for atleast a short-term sell, can be when the index breaks the 1D MA50. Also, currently, the downside potential can be as low as the 1D MA200 (orange trend-line), which by its current course can make contact with the price around Support 3 (15700). The 1D MA200 has been untouched for more than 10 months (since March 13 2023).
-------------------------------------------------------------------------------
** Please LIKE 👍, FOLLOW ✅, SHARE 🙌 and COMMENT ✍ if you enjoy this idea! Also share your ideas and charts in the comments section below! This is best way to keep it relevant, support us, keep the content here free and allow the idea to reach as many people as possible. **
-------------------------------------------------------------------------------
💸💸💸💸💸💸
👇 👇 👇 👇 👇 👇
Nasdaq 100 Index 15MLike and comment if you find value in our analysis.
Feel free to post your ideas and questions at the comments section.
Good luck

NASDAQ Post Cup & Handle rally in motion. There'll be pullbacks.Nasdaq (NDX) has completed a giant Cup & Handle pattern and since the late October 2023 bottom, it has started the post Handle rally. This rally historically tends to be a very long-term one but with its fair share of corrections to at least the 1W MA50 (blue trend-line).
As you know 2022 was the year of the Inflation Crisis (left side of the Cup) while 2023 was its recovery (right side of Cup). Going back to the 2 most recent Bear Cycles, the 2008 Housing Crisis and 2002 Dotcom Crisis, we can observe similar Cup & Handle patterns, with identical 1W RSI sequences (oversold on their bottom and starting a Channel Down when the Handle begins).
The rally that followed after the Handle in 2011 and 2005 started another pull-back to the 1W MA50 (ellipse) just a few months after when the 1W RSI hit the top of its Channel Down. The chart shows that we might be in a similar situation right now. As a result, long-term investors may seek an additional buy entry as close to the 1W MA50 as possible like the late October bottom.
-------------------------------------------------------------------------------
** Please LIKE 👍, FOLLOW ✅, SHARE 🙌 and COMMENT ✍ if you enjoy this idea! Also share your ideas and charts in the comments section below! This is best way to keep it relevant, support us, keep the content here free and allow the idea to reach as many people as possible. **
-------------------------------------------------------------------------------
💸💸💸💸💸💸
👇 👇 👇 👇 👇 👇

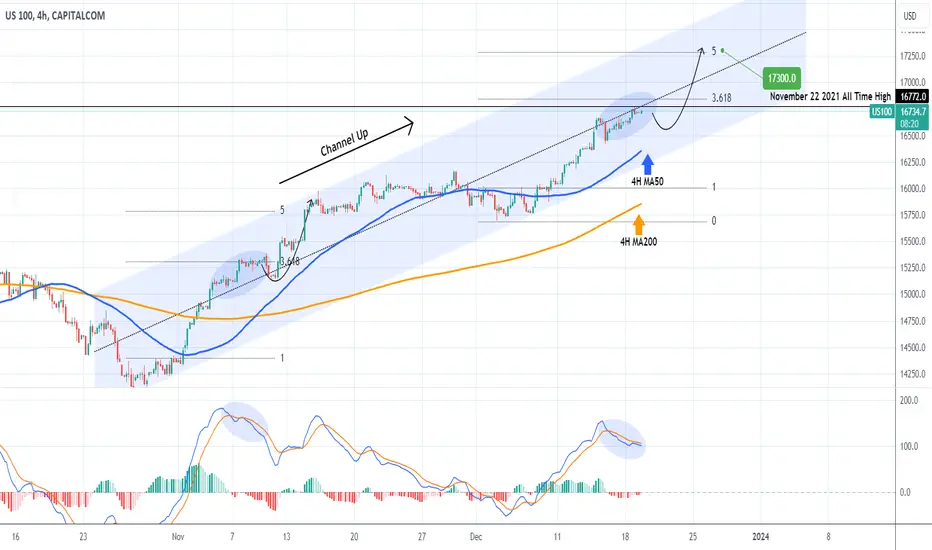
NASDAQ Hit the ATH but has one more push to give.Nasdaq (US100) hit yesterday the 16772 All Time High (ATH) level, reaching in the process our 16680 short-term target as shown on our December 11 call (see chart below):
The dominant pattern on the 4H time-frame is a Channel Up and the price is trading on its middle. As long as the 4H MA50 (blue trend-line) supports, any pull-back is a buy opportunity for at least one more push marginally above the 5.0 Fibonacci extension, as it happened on the November 14 pump. Our target is 17300.
-------------------------------------------------------------------------------
** Please LIKE 👍, FOLLOW ✅, SHARE 🙌 and COMMENT ✍ if you enjoy this idea! Also share your ideas and charts in the comments section below! This is best way to keep it relevant, support us, keep the content here free and allow the idea to reach as many people as possible. **
-------------------------------------------------------------------------------
💸💸💸💸💸💸
👇 👇 👇 👇 👇 👇
NDX Broke Double Bullish Pattern, 16600 SoonDear Traders,
NDX broke the falling channel (long purple trendlines) and then repeated a breakout from the falling wedge (short purple trendlines).
I believe NDX can continue its rally because MACD turned bullish, and I can see a confirmed bullish cross on the RSI. The price is above EMAs, and the volume is high enough for the continuation. I believe the target could be around 16600.
NDX is also overbought. While I expect further upside, traders without an existing position from lower target prices could wait for a corrective retracement to enter.
Kind regards,
Ely
