NDQ/DJI - Short; Significant Statistical Arbitrage opportunity!While the NDQ/DJI, itself, represents a significant trade opportunity here, even more notably, a number of the index components display remarkably skewed "Greeks"! (For example, APPL-GOOGL, CAT-PEP, TSLA-BA, etc..) E.g., It is a rather strait forward process - at these levels - to assemble baskets of stocks (Long) in each index (Short) with rather juicy, +30%-40% near term (<7 months!) profit targets.
All this is a strait forward process - once one starts looking :-)
p.s. Will provide ideas for some of these stock baskets if/as time allows.
Ndxsignals

NASDAQ 1st closing above the 1W MA50 in more than 1 year!Nasdaq (NDX) closed last week above the 1W MA50 (blue trend-line) for the first time since the week of January 10 2022, so effectively for more than 1 year. On this analysis we diverge from our usual 4H - 1D time-frame analysis such as the recent one below, and look into the bigger picture on the 1W time-frame:
Having broken two weeks ago above the Lower Highs trend-line of the Bear Cycle, this 1W MA50 closing last week is the last of the bullish confirmations we need to validate that the long-term trend has changed.
With the price however rejected on the 0.382 Fibonacci retracement level, we may see a short-term pull-back, especially since the 1W RSI hit the top of the Rising Wedge that is holding since March. The Support Zone is now within the 0.236 Fib and the 1W MA200 (orange trend-line). If however the index closes above the 0.382 first, we expect a structured continuation of the recovery to at least the 0.786 Fib by the start of Q3. See how almost perfectly the Fib retracement levels match key Resistance and Support lines of the Bear Cycle. The market should treat them as demand/ supply zone on the way up too.
-------------------------------------------------------------------------------
** Please LIKE 👍, FOLLOW ✅, SHARE 🙌 and COMMENT ✍ if you enjoy this idea! Also share your ideas and charts in the comments section below! **
-------------------------------------------------------------------------------
💸💸💸💸💸💸
👇 👇 👇 👇 👇 👇

NDX is setting up an island reversal pattern going into the nextMight still consolidate into early next week
It's a full Moon tomorrow, and markets like to top or bottom at or near the full Moon.
We def got the high here today and yesterday.

NASDAQ holding the 1 month patternNasdaq (NDX) is pull-back following Friday's high. This is nothing more than a technical 1-month pattern which, supported by the 4H MA50 (blue trend-line) is posting rises around +6% and pull-backs around -3.5%.
The 4H MA50 is currently a little over 11800 and a -3.80% pull-back (max on the pattern) can make exact contact with it tomorrow. With the Higher Lows trend-line just below it, we are willing to buy there and aim at a +5.85% rise at 12530.
The 4H RSI Buy Zone can offer additional insight on the buy entry. A break and closing below the 4H MA200 (orange trend-line), would be a trend change and sell signal towards 10800.
-------------------------------------------------------------------------------
** Please LIKE 👍, FOLLOW ✅, SHARE 🙌 and COMMENT ✍ if you enjoy this idea! Also share your ideas and charts in the comments section below! **
-------------------------------------------------------------------------------
💸💸💸💸💸💸
👇 👇 👇 👇 👇 👇

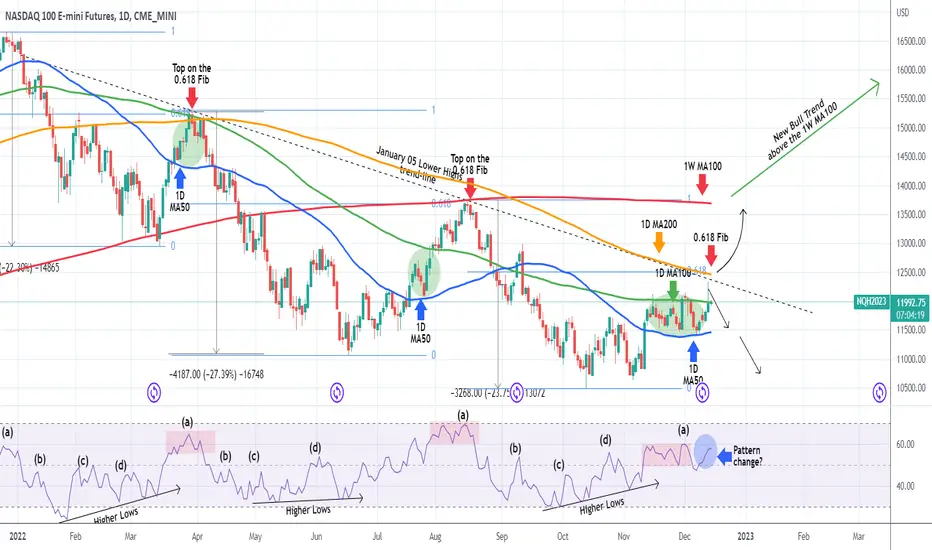
NASDAQ going neutral for a while, remains under Resistance.News are not the best for Nasdaq (NDX), at least on the short-term, as it got rejected a little over the 1D MA100 (green trend-line) and below the January 05 Lower Highs trend-line (Bear Cycle Resistance) and the 1D MA200 (orange trend-line). This marks the end of our buying trade as we called it on our previous post (January 04):
Right now we see, at best a repeat of the November 15 rejection, which turned the index sideways for a month. As long as the Support Zone holds, we will be buying the dip short-term. Below 10500, we will sell and target the -0.118 Fibonacci extension at 10100.
On the bright side, the 1D MACD shows that we are close to completing a bottom process similar to October 13. Still, we will only get long-term bullish above 12500 and the 0.618 Fibonacci, despite the fact that the 1D MA200 is the obvious long-term Resistance, unbroken since April 05. The reason is that with the Resistance Zone above it, we consider the Triangle area within the 0.618 Fib and the Bear Cycle's Lower Highs trend-line, a 'No-trade Zone'.
-------------------------------------------------------------------------------
** Please LIKE 👍, FOLLOW ✅, SHARE 🙌 and COMMENT ✍ if you enjoy this idea! Also share your ideas and charts in the comments section below! **
-------------------------------------------------------------------------------
💸💸💸💸💸💸
👇 👇 👇 👇 👇 👇

NASDAQ Don't look beyond this confirmed signalsNasdaq (NDX) hit last week and is so far holding the top of the 10500 - 10750 Support Zone, that has been in effect ever since the October 13 Bottom. As you see, the index has been under the Bear Market's Lower Highs trend-line since January 05, so essentially for a full year. The last rejection on it (December 13) was also made just below the 1D MA200 (orange trend-line) and the 0.618 Fibonacci retracement level from the previous (Lower High).
This practically keeps the index trapped and currently neutral. A confirmed buy signal would be a break above the 1D MA50 (blue trend-line), targeting again the 1 year Lower Highs trend-line, while a confirmed sell signal would be a break below 10500, targeting the -0.118 Fibonacci extension (10110).
-------------------------------------------------------------------------------
** Please LIKE 👍, FOLLOW ✅, SHARE 🙌 and COMMENT ✍ if you enjoy this idea! Also share your ideas and charts in the comments section below! This is best way to keep it relevant, support me, keep the content here free and allow the idea to reach as many people as possible. **
-------------------------------------------------------------------------------
You may also TELL ME 🙋♀️🙋♂️ in the comments section which symbol you want me to analyze next and on which time-frame. The one with the most posts will be published tomorrow! 👏🎁
-------------------------------------------------------------------------------
💸💸💸💸💸💸
👇 👇 👇 👇 👇 👇

NASDAQ rejected on the 1 year Resistance! How bearish is that?The Nasdaq index (NDX) rose yesterday aggressively after the lower than expected U.S. CPI but got rejected exactly on the 1 year Lower Highs trend-line (started on January 05), just below the 0.618 Fibonacci, as we showed on our analysis 2 weeks ago:
As you see, this is the exact cluster level (Lower Highs on 0.618 Fib) that the Highs of March 29 and August 16 were rejected. As a result, this doesn't alter our long-term perspective which continues to be based on break-outs. The 1D MA200 (orange trend-line) has been intact since April 05 and if the price breaks above it, we will turn bullish again, targeting the 1W MA100 (red trend-line), which rejected the August 16 High.
As long as the price is below the Lower Highs trend-line, we will be targeting the 1D MA50 (blue trend-line) where a candle close below will bring more selling pressure towards the Nov - Oct Lows.
It is worth mentioning though that the 4H RSI pattern that has been consistent in the previous Lower Lows - Lower Highs sequence these past 12 months, turned upwards (blue circle) instead of downwards. This may be an early signal that there is a long-term trend shift from bearish to bullish.
-------------------------------------------------------------------------------
** Please LIKE 👍, SUBSCRIBE ✅, SHARE 🙌 and COMMENT ✍ if you enjoy this idea! Also share your ideas and charts in the comments section below! This is best way to keep it relevant, support me, keep the content here free and allow the idea to reach as many people as possible. **
-------------------------------------------------------------------------------
You may also TELL ME 🙋♀️🙋♂️ in the comments section which symbol you want me to analyze next and on which time-frame. The one with the most posts will be published tomorrow! 👏🎁
-------------------------------------------------------------------------------
💸💸💸💸💸💸
👇 👇 👇 👇 👇 👇
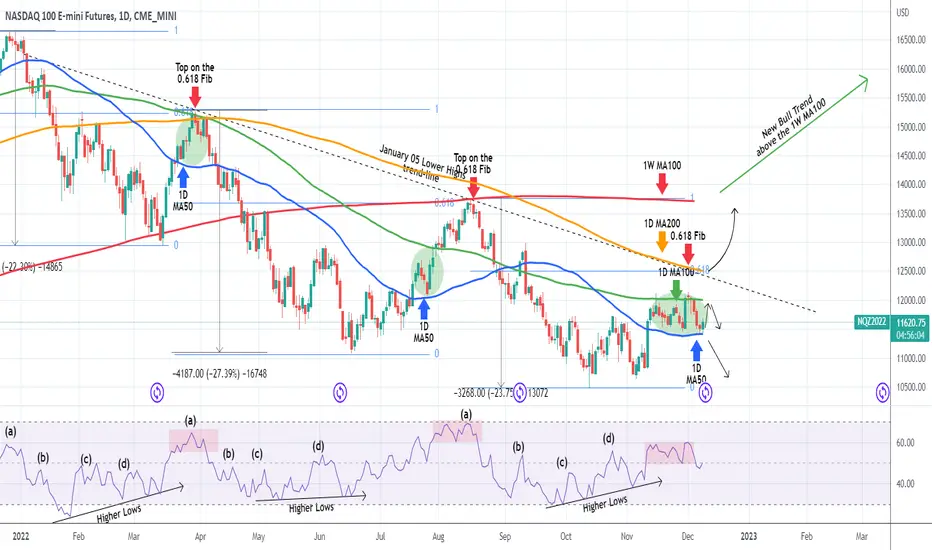
NASDAQ Almost 1 month trapped within the 1D MA50 - MA100Nasdaq (NDX) has been trading sideways since November 10, with the 1D MA50 (blue trend-line) as Support and the 1D MA100 (green trend-line) as Resistance. On a wide scale, this technically looks like the previous two market tops on the January 05 Lower Highs trend-line, and the 1D RSI illustrates that clearly. However, the Jul 19 - 28 consolidation within the 1D MA50/100 zone, did make a higher extension, so it is best to stay on the sidelines until we have a clear, confirmed break-out signal.
As long as the price remains within the 1D MA50 and 1D MA100, short-term traders can scalp the range. Since the January 05 Lower Highs trend-line is getting closer and closer to the 1D MA100, there is high risk in taking a buy break-out trade there. As the 1D MA200 is unbroken since April 05, it is best to take the break-out buy if a 1D candle closes above the 1D MA200 (orange trend-line), which would be also a break above the 0.618 Fibonacci level and target the 1W MA100 (red trend-line), which would be also a test of the 13,760 August 16 High.
On the other hand, a 1D candle close below the 1D MA50, would be bearish targeting 10850 and quite possibly aiming at a new (Lower) Low.
Notice that the 0.618 Fibonacci level is a critical Resistance level as it is where Nasdaq topped both on the March 29 and August 16 Lower Highs.
Also notice that the 1W MA100 is where the August 16 High was rejected.
-------------------------------------------------------------------------------
** Please LIKE 👍, SUBSCRIBE ✅, SHARE 🙌 and COMMENT ✍ if you enjoy this idea! Also share your ideas and charts in the comments section below! This is best way to keep it relevant, support me, keep the content here free and allow the idea to reach as many people as possible. **
-------------------------------------------------------------------------------
You may also TELL ME 🙋♀️🙋♂️ in the comments section which symbol you want me to analyze next and on which time-frame. The one with the most posts will be published tomorrow! 👏🎁
-------------------------------------------------------------------------------
💸💸💸💸💸💸
👇 👇 👇 👇 👇 👇
NASDAQ 20 days trapped within the 1D MA50 - MA100Nasdaq (NDX) has been trading sideways since November 10, with the 1D MA50 (blue trend-line) as Support and the 1D MA100 (green trend-line) as Resistance. On a wide scale, this technically looks like the previous two market tops on the January 05 Lower Highs trend-line, and the 1D RSI illustrates that clearly. However, the Jul 19 - 28 consolidation within the 1D MA50/100 zone, did make a higher extension, so it is best to approach this with our usual break-out strategy.
A 1D candle closing below the 1D MA50, would be bearish targeting 10850 and quite possibly aiming at a new (Lower) Low. On the other hand, a closing above the 1D MA100, will be treated as a short-term bullish extension signal to the 0.618 Fibonacci level and the 1D MA200 (orange trend-line), which is where Nasdaq topped both on March 29 and August 16.
A closing above the 1D MA200 would translate into a break above the January 05 Lower Highs trend-line, in which case, we will target the 1W MA100 (red trend-line), which rejected the uptrend last time on the August 16 High.
-------------------------------------------------------------------------------
** Please LIKE 👍, SUBSCRIBE ✅, SHARE 🙌 and COMMENT ✍ if you enjoy this idea! Also share your ideas and charts in the comments section below! This is best way to keep it relevant, support me, keep the content here free and allow the idea to reach as many people as possible. **
-------------------------------------------------------------------------------
You may also TELL ME 🙋♀️🙋♂️ in the comments section which symbol you want me to analyze next and on which time-frame. The one with the most posts will be published tomorrow! 👏🎁
-------------------------------------------------------------------------------
💸💸💸💸💸💸
👇 👇 👇 👇 👇 👇

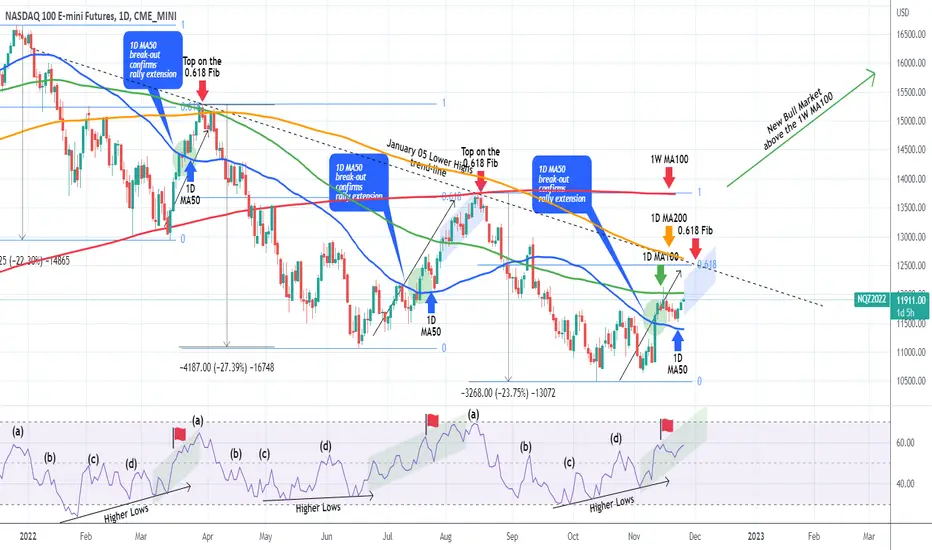
NASDAQ setting course for 12500Nasdaq (NDX) completed its short-term technical pull-back, as it held the 1D MA50 (blue trend-line) after it was rejected on the 1D MA100 (green trend-line). This doesn't change our outlook presented two weeks ago:
This profit-taking retracement was part of the greater plan, as the index remains within the tolerance levels of the previous counter-trend rebounds of the 2022 Bear Cycle, all of whom hit the Lower Highs trend-line that started on January 05.
As you see denoted by the green circle, every break above the 1D MA50 (blue trend-line) made a pull-back to test it as a Support shortly after. In terms of RSI , it appears that relative to the rallies of mid-March and July-August, we are just past the Red Flag. Now the minimum target on this bullish sequence is the Jan Lower Highs trend-line, that most likely will make a match on the 0.618 Fibonacci (as both previous rallies) and the 1D MA200 (orange trend-line) around the 12500 mark.
-------------------------------------------------------------------------------
** Please LIKE 👍, SUBSCRIBE ✅, SHARE 🙌 and COMMENT ✍ if you enjoy this idea! Also share your ideas and charts in the comments section below! This is best way to keep it relevant, support me, keep the content here free and allow the idea to reach as many people as possible. **
-------------------------------------------------------------------------------
You may also TELL ME 🙋♀️🙋♂️ in the comments section which symbol you want me to analyze next and on which time-frame. The one with the most posts will be published tomorrow! 👏🎁
-------------------------------------------------------------------------------
👇 👇 👇 👇 👇 👇
💸💸💸💸💸💸
👇 👇 👇 👇 👇 👇
NASDAQ Small technical pull-back part of the plan.Nasdaq (NDX) is on a short-term technical pull-back after it was rejected on the 1D MA100 (green trend-line). This doesn't change our outlook presented last week:
This profit-taking retracement is part of the greater plan, as the index remains within the tolerance levels of the previous counter-trend rebounds of the 2022 Bear Cycle, all of whom hit the Lower Highs trend-line that started on January 05.
As you see denoted by the green circle, every break above the 1D MA50 (blue trend-line) made a pull-back to test it as a Support shortly after. In terms of RSI, it appears that relative to the rallies of mid-March and July-August, we are where the Red Flag is. After the 1D MA50 pull-back is completed, the minimum target on this bullish sequence is the Jan Lower Highs trend-line, that most likely will make a match on the 0.618 Fibonacci (as both previous rallies) and the 1D MA200 (orange trend-line).
-------------------------------------------------------------------------------
** Please LIKE 👍, SUBSCRIBE ✅, SHARE 🙌 and COMMENT ✍ if you enjoy this idea! Also share your ideas and charts in the comments section below! This is best way to keep it relevant, support me, keep the content here free and allow the idea to reach as many people as possible. **
-------------------------------------------------------------------------------
You may also TELL ME 🙋♀️🙋♂️ in the comments section which symbol you want me to analyze next and on which time-frame. The one with the most posts will be published tomorrow! 👏🎁
-------------------------------------------------------------------------------
👇 👇 👇 👇 👇 👇
💸💸💸💸💸💸
👇 👇 👇 👇 👇 👇
Bullish NASDAQ WOLFE WAVE SETUPThere is also a bullish wolfe wave setting up on the 4hr and 3D time-frames which all can be used for supporting evidence that a strong rally is nearing. The projected target is calculated by extending a linear line between pivot 1 and 4 and projecting the line. This is represented as the line perforated line, as shown in the chart. If we extend a vertical line from the apex to the perforated target line, the time and price meet on Nov 29, 2022 at 14400. This is a very aggressive time and price target; however, there is a gap open at $13225 and it will most likely fill this year, so I expect the midterm elections along with tax loss selling and christmas rally into january effect will all contribute to a strong rally. I hope the analysis serves you well and you remain on the right side of the market.

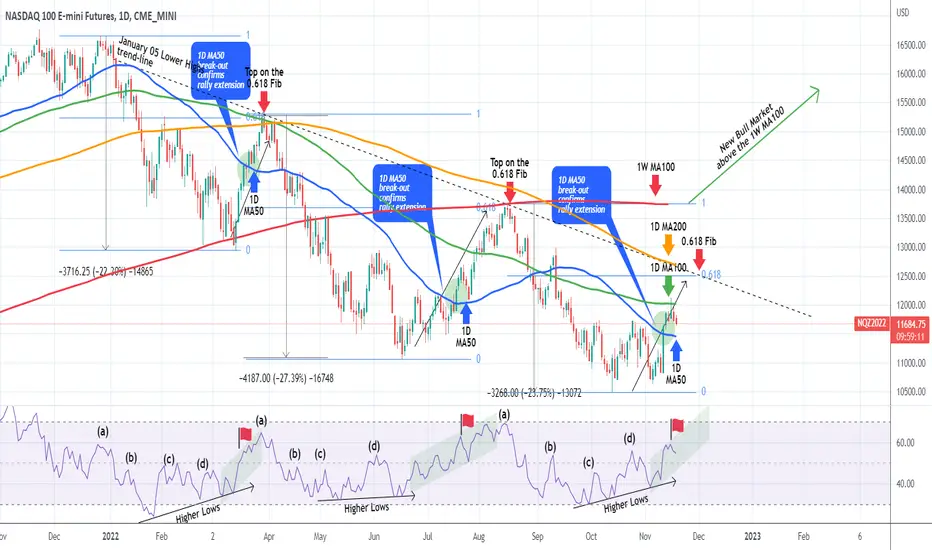
NASDAQ Broke the 1D MA50, targeting 12500.The Nasdaq index (NDX) is making its reversal as following the much lower than expected U.S. CPI report (fell to 7.7% from 8.2% the previous month), it posted the strongest 1 day rise of the year and broke above its 1D MA50 (blue trend-line) for the first time since September 13 (two months). The news that the Fed's approach has started to decrease inflation and the hopes that gives that they may consider easing their rate hike strategy, are fundamentally very bullish for the highly hurt tech sector.
Technically, this 1D MA50 break-out as well as the 1D RSI sequence, is consistent so far with the previous two counter trend rallies in 2022 (March 15 - 29 and June 16 - August 16). Both extended their rallies after breaking their 1D MA50 and topped on the 0.618 Fibonacci retracement level, forming the (dashed) Lower Highs trend-line. The current 0.618 Fib is exactly on the 12500 level.
If that is hit within 7 days, it will make contact with the Lower Highs trend-line as well as the 1D MA200 (orange trend-line), which is intact since April 06. Technically the Resistance level to beat in order to enter a new Bull Cycle is the 1W MA100 (red trend-line), which rejected the August 16 top and has been holding since April 28, being previously the Support of the Bull Run.
-------------------------------------------------------------------------------
** Please LIKE 👍, SUBSCRIBE ✅, SHARE 🙌 and COMMENT ✍ if you enjoy this idea! Also share your ideas and charts in the comments section below! This is best way to keep it relevant, support me, keep the content here free and allow the idea to reach as many people as possible. **
-------------------------------------------------------------------------------
You may also TELL ME 🙋♀️🙋♂️ in the comments section which symbol you want me to analyze next and on which time-frame. The one with the most posts will be published tomorrow! 👏🎁
-------------------------------------------------------------------------------
👇 👇 👇 👇 👇 👇
💸💸💸💸💸💸
👇 👇 👇 👇 👇 👇

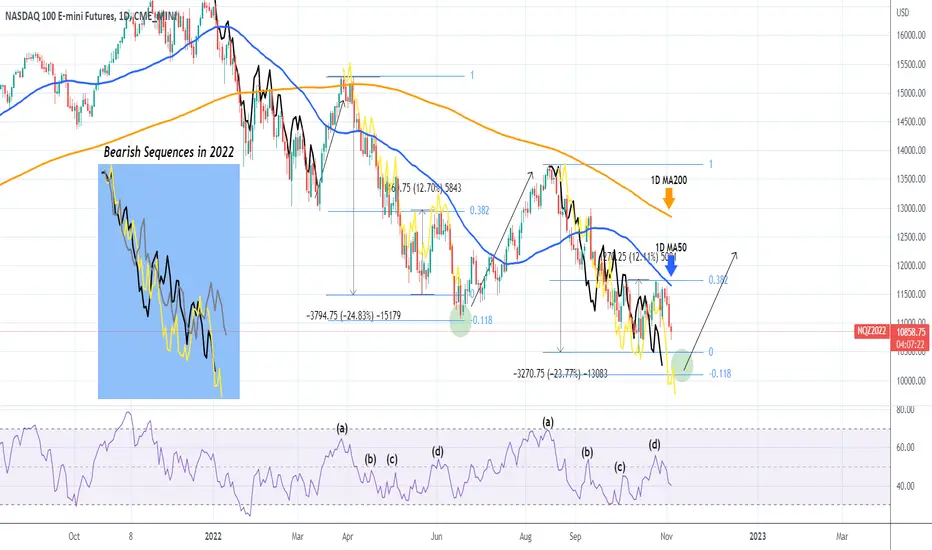
NASDAQ One last Low left on perfect symmetryNasdaq (NDX) is pulling-back following the Fed's +0.75% Rate Hike and a rejection on Tuesday on the 1D MA50 (blue trend-line). With the help of the RSI on the 1D time-frame, we can see that so far the whole bearish sequence since the August 16 High, is very similar to the bearish sequence that followed after the March 30 High.
A striking similarity is that both got rejected on the 0.382 Fibonacci retracement level just under the 1D MA50. On June 03 that was the rejection that delivered the last sell-off before the mid-June - mid-August rally. That sell-off made its Low on the -0.118 Fibonacci extension. On the current Bearish Sequence, this extension is on 10105.
For illustration and better comparison purposes, I have plotted the first two Bearish Sequences od 2022 on top of the current (post August 16 High) and on the blue table all three together. The pattern is obvious.
-------------------------------------------------------------------------------
** Please LIKE 👍, SUBSCRIBE ✅, SHARE 🙌 and COMMENT ✍ if you enjoy this idea! Also share your ideas and charts in the comments section below! This is best way to keep it relevant, support me, keep the content here free and allow the idea to reach as many people as possible. **
-------------------------------------------------------------------------------
You may also TELL ME 🙋♀️🙋♂️ in the comments section which symbol you want me to analyze next and on which time-frame. The one with the most posts will be published tomorrow! 👏🎁
-------------------------------------------------------------------------------
👇 👇 👇 👇 👇 👇
💸💸💸💸💸💸
👇 👇 👇 👇 👇 👇
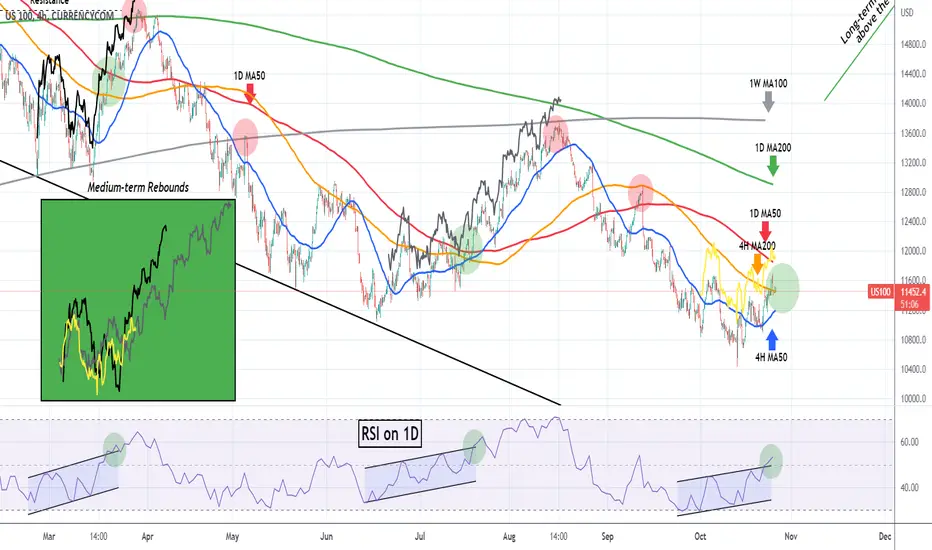
NASDAQ Bullish reversal confirmed as per previous 2022 reboundsJust a few days following our last analysis, the Nasdaq Index (NDX) broke above its 4H MA200 (orange trend-line) for the first time since August 26:
As mentioned then, the factor that made the difference in our decision to call for a buy was the RSI Bullish Divergence on the 1D time-frame which has been trading on Higher Highs/ Higher Lows (Channel Up) since October 03, while the actual price action has been on Lower Highs and Lower Lows (Channel Down).
The current rebound is consistent with the previous medium-term rebounds throughout the 2022 Bear Cycle, that started after the bottoms of February 24 and June 16. We can see the very same Channel Up on the 1D RSI during those bottoms. Both of those medium-term rebounds, broke above the 1D MA50 (red trend-line) and targeted the 1D MA200 (green trend-line), which has marginally hit on the March 29/30 High and approached on the August 16 High. Interestingly enough, the RSI Channel Up patterns broke to the upside around the time the price broke above the 4H MA200.
With the 4H MA200 broken, our short-term target is now the 1D MA50 and the medium-term 300 points below the 1D MA200. The projection from where we stand today, puts the 1D MA200 just above 12500 by mid November.
For comparison purposes in order to get a better understanding of Nasdaq's proportionate position compared to the previous rebounds, we've plotted all rebound sequences on top of another (Black line = Feb 24 - March 30, Grey line = June 21 - August 16 and Yellow line = October 02 - today). It is obvious how closely correlated all three sequences are.
-------------------------------------------------------------------------------
** Please LIKE 👍, SUBSCRIBE ✅, SHARE 🙌 and COMMENT ✍ if you enjoy this idea! Also share your ideas and charts in the comments section below! This is best way to keep it relevant, support me, keep the content here free and allow the idea to reach as many people as possible. **
-------------------------------------------------------------------------------
You may also TELL ME 🙋♀️🙋♂️ in the comments section which symbol you want me to analyze next and on which time-frame. The one with the most posts will be published tomorrow! 👏🎁
-------------------------------------------------------------------------------
👇 👇 👇 👇 👇 👇
💸💸💸💸💸💸
👇 👇 👇 👇 👇 👇
NASDAQ This drop is limited. Medium-term targets around 12500.The Nasdaq Index (NDX) has been pulling-back since Tuesday's (Oct 18) Lower High and is once again on its 4H MA50 (blue trend-line). What can be the difference maker here is the RSI on the 1D time-frame which has been trading on Higher Highs/ Higher Lows (Channel Up) since October 03, while the actual price action has been on Lower Highs and Lower Lows (Channel Down). This is a technical Bullish Divergence, often seen on market bottoms (temporary or not).
Since the long-term trend throughout 2022 has been bearish (Bear Cycle), we have to consider this as a temporary bottom at least for now. Such bottoms have been on February 24 and June 16 so far. Interestingly enough, we can see the very same Channel Up on the 1D RSI during those bottoms. Also we can see that their duration with today's is fairly symmetrical. Those bottoms started medium-term rebounds, which broke above the 1D MA50 (red trend-line) and targeted the 1D MA200 (green trend-line), which has marginally hit on the March 29/30 High and approached on the August 16 High.
They trigger to start a bullish break-out has been the 4H MA200 (orange trend-line) and right now Nasdaq is trading below it. If it breaks, the short-term target should be the 1D MA50 and the medium-term the 1D MA200. The projection from where we stand today, puts the 1D MA200 just above 12500 by mid November.
For comparison purposes in order to get a better understanding of Nasdaq's proportionate position compared to the previous rebounds, I've plotted both sequences on today's price action (black and grey lines).
-------------------------------------------------------------------------------
** Please LIKE 👍, SUBSCRIBE ✅, SHARE 🙌 and COMMENT ✍ if you enjoy this idea! Also share your ideas and charts in the comments section below! This is best way to keep it relevant, support me, keep the content here free and allow the idea to reach as many people as possible. **
-------------------------------------------------------------------------------
You may also TELL ME 🙋♀️🙋♂️ in the comments section which symbol you want me to analyze next and on which time-frame. The one with the most posts will be published tomorrow! 👏🎁
-------------------------------------------------------------------------------
👇 👇 👇 👇 👇 👇
💸💸💸💸💸💸
👇 👇 👇 👇 👇 👇

NASDAQ One last leg down or break above the 1D MA50?Nasdaq (NDX) is extending the Channel Down that started on the August 16 2022 High, making a Lower Low yesterday. With the assistance of the 1D RSI, we have spotted a recurring pattern that has already played out two times during this Bear Cycle since the start of the year and is currently forming the third one.
As you see, every such Lower Low sequence, made a bottom when the 1D RSI made a Low at the same level as the previous one. It is shown that the RSI has a somewhat triple bottom before the price rebounds. Right now the RSI is approaching the 30.000 level where the September 30 Low was made. The bottom of the previous Lower Low sequence was made on June 16 on the -0.5 Fibonacci extension from the March 15 Low. If each Low is a Fib level higher then the current one could be either on the -0.382, which is just below the 1W MA300 (yellow trend-line) or the -0.236 (just above the 10000 mark). Either way, the buy signal is given when the RSI hits 30.000.
It is not unlikely though to see a rebound without dipping that low as the sequence is almost completed and we saw a bullish reaction yesterday to the CPI. So if the index breaks above the 1D MA50 (blue trend-line) next, we can see a bullish extension towards the 1W MA100 (grey trend-line), which is the current Resistance as it has provided the last two rejection on August 16 and May 05.
-------------------------------------------------------------------------------
** Please LIKE 👍, SUBSCRIBE ✅, SHARE 🙌 and COMMENT ✍ if you enjoy this idea! Also share your ideas and charts in the comments section below! This is best way to keep it relevant, support me, keep the content here free and allow the idea to reach as many people as possible. **
-------------------------------------------------------------------------------
You may also TELL ME 🙋♀️🙋♂️ in the comments section which symbol you want me to analyze next and on which time-frame. The one with the most posts will be published tomorrow! 👏🎁
-------------------------------------------------------------------------------
👇 👇 👇 👇 👇 👇
💸💸💸💸💸💸
👇 👇 👇 👇 👇 👇

NASDAQ Repeating the April-May fractal and how it can be avoidedNasdaq has been trading within a Channel Down pattern since the short-term High of August 16 that was rejected on the 1W MA100 (gray trend-line). The minor rise at the start of the week has turned sideways as it approached the top (Lower Highs trend-line) of the Channel and the market prepares for the Nonfarm Payrolls today.
Based also on the 1D RSI structure, this pattern resembles so far the April - May Channel Down. As long as the price remained below the 1D MA50 (blue trend-line), it made a Lower Low on June 16 before gradually starting to recover and eventually break above the 1D MA50 and towards the 1D MA200 (orange trend-line).
As a result, we may be looking for a Lower Low near the 1W MA300 (yellow trend-line), now that the 1W MA200 (red trend-line) broke. A closing above the 1D MA50 should be taken as a bullish break-out signal on the short-term targeting the 1D MA200 and 1W MA100. Only a weekly closing above the 1W MA100 can be considered as an attempt to shift the long-term trend from bearish to bullish.
-------------------------------------------------------------------------------
** Please LIKE 👍, SUBSCRIBE ✅, SHARE 🙌 and COMMENT ✍ if you enjoy this idea! Also share your ideas and charts in the comments section below! This is best way to keep it relevant, support me, keep the content here free and allow the idea to reach as many people as possible. **
-------------------------------------------------------------------------------
You may also TELL ME 🙋♀️🙋♂️ in the comments section which symbol you want me to analyze next and on which time-frame. The one with the most posts will be published tomorrow! 👏🎁
-------------------------------------------------------------------------------
👇 👇 👇 👇 👇 👇
💸💸💸💸💸💸
👇 👇 👇 👇 👇 👇

NASDAQ Testing the 1W MA200. Is it on the brink of collapse?------------------------------------------------------------------------------------------
** Please LIKE 👍, SUBSCRIBE ✅, SHARE 🙌 and COMMENT ✍ if you enjoy this idea! Also share your ideas and charts in the comments section below! This is best way to keep it relevant, support me, keep the content here free and allow the idea to reach as many people as possible. **
------------------------------------------------------------------------------------------
This is the Nasdaq index (NDX) on the 1W time-frame, where it hit the 1W MA200 (orange trend-line), for the first time since July 2010! Coupled with the 1W MACD just forming a Bearish Cross in the previous week, inevitably similarities emerge with the 2008 Housing Crisis.
And rightly so as until now, the 2022 correction has been very similar to October 2007 - July 2008. As you see after the index started falling initially, the price rebound at (or very close to in the case of 2022) the 1W MA200. The subsequent rebound, hit (or in the case of 2022 nearly hit) the 1W MA50 (blue trend-line), which in turn rejected the uptrend and turned the trend downwards again towards the 1W MA200.
It would appear that we are at this important level now where in July 2008 the 1W MA200 provided one last rebound before one final rejection on the 1W MA50 that on September 2008 broke below the 1W MA200 finally and caused a -42% collapse. Notice that the 1W Death Cross (MA50 crossing below the MA200), though a bearish pattern, it was formed right at the bottom of the Cear Cycle. Both then and now the 1W RSI was trading under Lower Highs, which when broke, signalled the start of the recovery and the new Bull Cycle. Also the 1W MACD took a Bearish - Bullish - Bearish Cross sequence before the -42% collapse.
What this chart shows is that the emphasis should be on the current test of the 1W MA200. A trend-line tested three times since February 2010 and provided extremely strong Bull Phases, with COVID crash (March 2020) being the most recent. A break below it, could initiate a 2008 type collapse, with a -40% from current levels placing the target around the COVID March 2020 Low (6650). On the other hand, it shows that the 1W MA50 is the current Resistance and if broken first (after it failed this August), it could invalidate the extension of the Bear Market and save the day for stocks.
What do you think will happen next?
------------------------------------------------------------------------------------------
You may also TELL ME 🙋♀️🙋♂️ in the comments section which symbol you want me to analyze next and on which time-frame. The one with the most posts will be published tomorrow! 👏🎁
------------------------------------------------------------------------------------------
👇 👇 👇 👇 👇 👇
👇 👇 👇 👇 👇 👇
👇 👇 👇 👇 👇 👇

NASDAQ Neutral so far. See which break-outs to trade.The Nasdaq Index (NDX) staged a fair rebound yesterday on a Lower Lows trend-line that started on the September 01 Low. Today we see an early rejection on the futures market, which from one side is expected as the market is preparing for Wednesday's Fed Rate Decision. The 4H RSI however has been on Higher Lows since August 22, staging a Bullish Divergence.
The last similar Divergence was spotted during the May 12 - 20 Lower Lows. When the index broke above the 4H MA50 (blue trend-line) for the second time, it targeted the 4H MA200 (orange trend-line).
As a result, our short-term plan is to wait for either that 4H MA50 break-out and target the 4H MA200 or the Lower Lows break-out and target the 1W MA200 (red trend-line). As a side-note, notice how the index has been trading on symmetrical Lower Highs as well (Aug 26 and Sep 13), thus we can view the price action as a Channel Down. The 4H MA200 (our bullish target) is exactly at the top (Lower Highs trend-line) of that Channel Down.
--------------------------------------------------------------------------------------------------------
** Please support this idea with your likes and comments, it is the best way to keep it relevant and support me. **
--------------------------------------------------------------------------------------------------------

NASDAQ Thinly supported. Needs a 1D MA50 break to avoid sell-offThe Nasdaq (NDX) index had a strong rejection these past 4 weeks exactly on the level we projected on our idea on August 04:
Right now it is trading below both the 1D MA50 (blue trend-line) and the 1D MA100 (green trend-line), which were its short-term Support levels and have now turned into Resistances as each have rejected upwards break-out attempts at least once.
Being on the 0.236 Fibonacci retracement level and based on the RSI (1W time-frame), which just hit its MA line (yellow), NDX appears to be in a similar level its was during April 11 - 20. This consolidation led lower when its Support broke and dropped first to the previous Low (0.0 Fib) and then to Lower Lows on the -0.382 and -0.5 Fibs respectively. As a result, if the current Support breaks, we expect the 1W MA200 (red trend-line) to be tested, which is slightly above the 11040 Lot of June 16 and depending on the market conditions at the time (which we will surely update on), the 1W MA300 (yellow trend-line), which is slightly above the -0.382 Fib.
On the bullish case, if the price breaks above the 1D MA50, consider it a buy break-out signal and target the 1W MA200 (orange trend-line).
--------------------------------------------------------------------------------------------------------
** Please support this idea with your likes and comments, it is the best way to keep it relevant and support me. **
--------------------------------------------------------------------------------------------------------

NDX 100Honestly thinking we are in a strong downtrend here until mid terms are over, after that I would expect we start w3 on the HTF. Leading the tech sector into the final 5th wave into 2023.

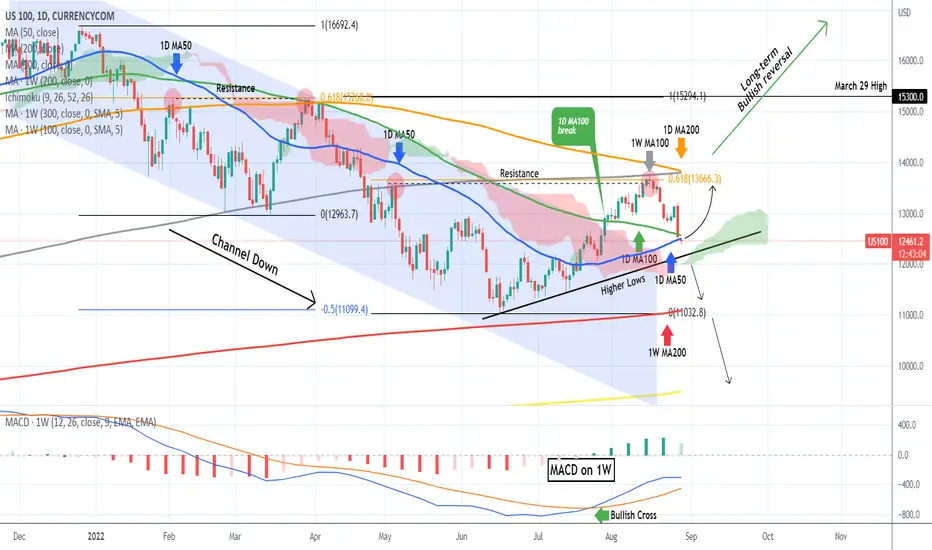
NASDAQ hit a Support cluster. Trading scenarios for September.The Nasdaq (NDX) index had a strong rejection these past 2 weeks exactly on the level we projected on our idea on August 04:
As you see, that level was the 0.618 Fibonacci Retracement level and the Resistance made from the May 05 High, which we predicted based on the symmetrical evidence with the February - March fractal. So far this has been working out perfectly, I can add that the rejection also took place exactly on the 1W MA100 (grey trend-line) and just shy off the 1D MA200 (orange trend-line).
This 2-week pull-back hit on Friday the 1D MA100 (green trend-line) and today the 1D MA50 (blue trend-line). This is an important Support cluster, assisted further by the Higher Lows trend-line that started on the June 16 Low.
What favors the bearish case is certainly the fact that the price got rejected on the 1W MA100 that was previously a Support (February 24, March 14) but is now establishing itself as a Resistance (May 05, August 16) and the inability to break above the 1D MA200, which is where the price was rejected on March 30. Those are in favor of the sequence continuing to repeat the Feb-March fractal, which sold-off to a new Lower Low.
The bullish case in however still backed up by the MACD Bullish Cross on the 1W time-frame that took place on July 22, which didn't happen previously in March or April. That strengthens further the 1D MA50/100 and June Higher Lows Support cluster. As long as that holds (staying above the now green Ichimoku Cloud), it should be more likely to retest the 1W MA100/ 1D MA200 Resistance Zone. As mentioned before, a candle close above that Resistance Zone should be enough to shift the long-term sentiment from bearish to bullish.
A close below the Higher Lows though, should deliver a test of the 1W MA200 (red trend-line), which is the current long-term Support and if also broken, then the 1W MA300 (yellow trend-line).
--------------------------------------------------------------------------------------------------------
** Please support this idea with your likes and comments, it is the best way to keep it relevant and support me. **
--------------------------------------------------------------------------------------------------------