NASDAQ the 2Y yield and Interest RateThe Nasdaq index (NDX) has been on a strong rally since the mid June bottom but this week's pull-back is having a good part of investors worried. Well not without good reason as this is taking place after breaking its All Time High Lower Highs trend-line and but not its 1D MA200. However it may be a correction attributed to profit taking and this analysis will address that in relation to the US02Y (2 year bond yield illustrated in orange) and the Fed's Interest Rate (black trend-line).
As you see, the US02Y can be a leading indicator to what the Fed policy may be. In recent tightening Cycles, more particularly in November 2018, when the US02Y started to reverse downwards, it was an early indication that the Interest Rate would peak. Indeed, the monetary tightening policy turned flat and in a few months changed to monetary easing again, falling sharply downwards. The Nasdaq bottomed a little after the US02Y started falling.
This time, the mid June rally started just after the first sharp drop on the US02Y and following the yields' volatility, gave fuel to this sharp two month rise. At the same time the Interest Rate continues to rise but the Fed have issued a very supportive tone in their last meeting regarding the pace of tightening, a move that is obvious calmed the markets more than enough.
I want to focus on the similarities of these two corrections (2018 and 2022). In both cases, Nasdaq bottomed right after breaking its 0.382 Fibonacci retracement level, while holding the 1W MA200 (red trend-line) as the long-term Support.
Do you think this time is different or a similar 2019 rally will follow?
P.S. Because the chart has the added elements of the US02Y and Interest Rate plotted and are not constant, it may appear distorted based on your screen's/ browser dimensions. The original looks like this below, so if yours doesn't, adjust the vertical/ horizontal axis in order to make it look like this and better understand what is illustrated:
--------------------------------------------------------------------------------------------------------
** Please support this idea with your likes and comments, it is the best way to keep it relevant and support me. **
--------------------------------------------------------------------------------------------------------
Ndxsignals

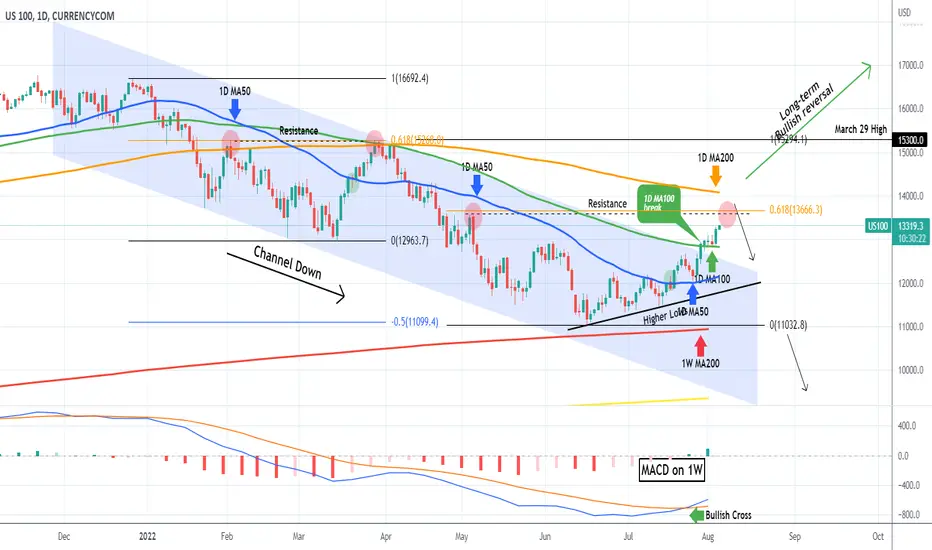
NASDAQ close to entering back to the bull marketNasdaq (NDX) extended the uptrend following the two clear break-out buy signals given by the 1D MA50 (blue trend-line) and the 1W MACD Bullish Cross, as we outlined on our previous analysis 3 weeks ago:
Perhaps the most important development since then is the closing above the 1D MA100 (green trend-line) which last time rejected the price (March 29) and formed a Lower High on the long-term Channel Down. This doesn't turn the trend bullish long-term. It remains bearish unless we break above the 1D MA200 (orange trend-line), which isn't that far off. It was that and the 0.618 Fibonacci retracement level (13666 currently) that along with the 1D MA100 rejected the uptrend on the previous Lower High.
As a result a sell there with a tight SL on the 1D MA200 can be justified, targeting the 1D MA50 on the short-term. On the other hand, a close above the 1D MA200 should be considered a buy break-out signal, which can target the 15300 March 29 High.
--------------------------------------------------------------------------------------------------------
Please like, subscribe and share your ideas and charts with the community!
--------------------------------------------------------------------------------------------------------
NASDAQ Generational Buy Opportunity. The 14 year Channel held.Nasdaq (NDX) is coming off a (near) hit on the 1W MA200 (orange trend-line) last month and the rebound is now closer than ever to test the 1W MA100 (red trend-line) for the first time since April 05, where it was emphatically rejected. This is something that we outlined on our previous NDX analysis that was on the 1D time-frame:
This time we present an analysis based on the 1W time-frame and longer-term parameters as the index not only prepares for this quarterly bullish break-out but with its current monthly rally it holds historic Support levels.
First of all, as the chart shows, the index has been trading upwards (on the log scale) within a 14 year Channel since the 2008/09 Subprime Mortgage (housing) Crisis. As mentioned, it held the 1W MA200 which has never been crossed below since the weekly candle of June 28 2010, but as you see it formed a clear Bullish Cross on the 1W MACD. We've discussed the importance of such crosses in previous posts but for Nasdaq in particular, when that took place around the 0.0 MACD mean (especially from the 2018 volatility period and after), it has been a tremendous buy opportunity, especially when coupled with a break above the 1D MA100.
We can therefore claim that a 1D MA100 break is the last Bullish Confirmation signal on a multi-year scale that validates the start of the near rally within the 14 year Channel, even though some would argue that technically the last Resistance to beat would be the 1W MA50 (blue trend-line)/ 1D MA200 cluster. But for this long-term model, the 1D MA100 seems good enough for a confirmation signal.
For illustration purposes, I've plotted every candle series that after approaching the 1W MA200, broke above the 1D MA100 and (naturally) kick-started a rally (including of course that after the 2009 bottom). It is interesting to see that if repeated, all of them can make an All Time High (before correcting) much above the previous market High, with the exception of the shortest 2019 rally, which would stop just above the previous All Time High.
Note that those are for projection purposes for sure and nothing more as the index may follow a completely different path this time, but interesting as illustrations indeed. Do you think the Channel will hold and guide the price to new ATH?
P.S. As always on long-term log Channels, we've incorporated the -0.236 and 1.236 extremes, which in the case of Nasdaq match almost perfectly the March 2020 (irregular) Black Swan event that broke for just one week below the Channel.
--------------------------------------------------------------------------------------------------------
Please like, subscribe and share your ideas and charts with the community!
--------------------------------------------------------------------------------------------------------

NDX | Trading at ResistanceNDX 100 is Trading at resistance and the short retracement is possible but seems Bullish in the long term
Note: Trade at your own Risk!

NASDAQ 1W MACD Bullish Cross and 1D MA50 break-outThe Nasdaq (NDX) index is posting today a full 1D candle above the 1D MA50 (blue trend-line) for the first time since April 08. We are still inside the long-term Channel Down formation that started at the beginning of the year but with the 1W MACD making a Bullish Cross for the first time since November 2021, while the price has been on Higher Lows for a full month, there are more probabilities to be seeing the start of a long-term trend reversal.
On the short-term we should approach this in terms of MA break-outs. Right now the first target is the 1D MA100 (green trend-line), which sits naturally at the top of the Channel Down and rejected the price on the last Lower High in April 04.
--------------------------------------------------------------------------------------------------------
** Please support this idea with your likes and comments, it is the best way to keep it relevant and support me. **
--------------------------------------------------------------------------------------------------------

NDX The Nasdaq reached a good correctional areas for buying, in addition to touching the bottom of the descending corrective channel.
Follow us for more ideas

NASDAQ On a critical 1D MA50 test. Act depending on candle closeNasdaq (NDX) continues to trade within the long-term Channel Down that has helped us identify the trend and take low risk/ high reward trades over the past few months. Our position hasn't changed since our previous update 10 days ago:
The bottom and new Lower Low of the Channel was correctly spotted, and now the price is about to test the critical 1D MA50 (blue trend-line). In fact today's flat-red candle could be the same as the rejection one on March 21. A clear 1D candle close above it, should be enough to test the 1D MA100 (green trend-line) which was our medium-term target originally. Failure to do so can alter the similarities with the March fractal and push the price to the 1W MA200 (red trend-line), so in that case be quick to take profits if you followed us and bought on that bottom.
As mentioned previously, a 1D candle close above the Lower Highs (top) trend-line of the Channel Down should be treated as a buy break-out signal with the 1D MA200 (orange trend-line) as the target. Similarly, with the 1W MA200 being a significant multi-year Support, a weekly closing below it should target the 1W MA300 (yellow trend-line, scroll chart to see it below).
--------------------------------------------------------------------------------------------------------
Please like, subscribe and share your ideas and charts with the community!
--------------------------------------------------------------------------------------------------------

NDX/USD Its just an idea nothing else.ndx forms a W Bullish pattern. at point 1st buy it retested its spot and boom. lets see what happens next

NASDAQ Sideways but still off the top of the Channel DownNasdaq (NDX) has been trading sideways since May 30. The 1D MA50 (blue trend-line) is right above with the 1D MA100 (green trend-line) being roughly around the Lower Highs (top) trend-line of the Channel Down.
Based on our previous analysis 2 weeks ago, the index was on a W pattern aiming at the Resistance as part of the Lower Highs formation:
So far so good if you took that buy, you may start taking profit at will. The reason is that only a break above the 1D MA100 can justify further buying and that's only to the 1D MA200 (orange trend-line), which last time rejected the uptrend from March 29 to April 05. Until the Lower Highs break, the trend is bearish towards the 11500 Support. A confirmed sell if you are looking for a lower risk factor, would be when the MACD makes a Bearish Cross.
As for a long-term bullish reversal only a weekly candle closing above the 15300 March 29 High can sustain it.
--------------------------------------------------------------------------------------------------------
Please like, subscribe and share your ideas and charts with the community!
--------------------------------------------------------------------------------------------------------

NDX Collapse ScenarioUsing Fib circles to plot how price falls
Both corrections are around -80%
A fall like this allows for a third touch on the up channel that is apparent
Bars pattern placed (red) is just my thoughts of how price could act if this scenario occurs

NASDAQ It is now or never for tech.Nasdaq (NDX) has been trading within a Falling Wedge since its All Time Highs and contrary to the last analysis, it broke the 1W MA100 (red trend-line) and almost hit the bottom (Lower Lows trend-line) of the Falling Wedge.
As long as this holds, we can expect a rebound towards the Lower Highs trend-line (top) of the Wedge and more specifically the 0.618 Fibonacci retracement level, which formed the previous Lower High and is currently around 14300. Notice how potentially, it could meet with the 1D MA100 (green trend-line) there. The 1D RSI seems to be bouncing off the Pivot.
If on the other hand the Lower Lows trend-line breaks, the next Support level is the 12200 low of March 05 2021 but we doubt it will hold on panic selling and the hidden targets will be the -0.236 and -0.382 Fib extension at around 12115 and 11745 respectively.
--------------------------------------------------------------------------------------------------------
** Please support this idea with your likes and comments, it is the best way to keep it relevant and support me. **
--------------------------------------------------------------------------------------------------------

NDX W-Shaped RecoveryI think we might see the end of the war soon.
Russia says the first phase of its “military operation” in Ukraine is mostly complete.
I am considering a W-Shaped Recovery on NDX and a price target of $15670.
Looking forward to read your opinion about it.

NASDAQ Still bearish despite the RSI break-outNasdaq has been trading within a Channel Down since the January 24 Low. The index is approaching today the top (Lower Highs trend-line) of the Channel and will remain bearish, unless it breaks above the 1D MA50 (blue trend-line), which comfortably sits just above the top of the Channel. That should target the 1D MA200 (orange trend-line), which trends just below the 0.618 Fibonacci retracement level.
If the price is rejected though at the top of the Channel Down or on the 1D MA50, expect a re-test of the 12930 Support and if broken the -0.236 Fibonacci extension. It has to be said though that the 1D RSI broke yesterday above the Lower Highs trend-line since November 04. That is the first bullish sign since the correction started.
--------------------------------------------------------------------------------------------------------
** Please support this idea with your likes and comments, it is the best way to keep it relevant and support me. **
--------------------------------------------------------------------------------------------------------

NASDAQ changing channel bands for the next 10 years?This is Nasdaq on the 1M time-frame since the recovery from the sub-prime mortgage crisis was set in motion in 2010.
As shown, the index has been trading within a Channel Up (log chart) from 2010 until mid 2020. Then in July 2020, it appears that NDX switched bands to one zone higher, illustrated perfectly by using the Fibonacci Channel extensions. As you see, since July 2020, the Fib 1.0 level which was previously the Resistance (top/ Higher Highs trend-line) of the former 2010 - 2020 Channel, has turned into a Support (bottom/ Higher Lows trend-line), and is being currently tested by the current 1M candle of February.
Every such Channel bottom test, has been a unique long-term buy opportunity during these +10 years. With the 1M MA50 (blue trend-line) rising rapidly towards the 1.0 Fib level, do you think that will turn into a Support for the next 10 years? Based on this pattern, that looks like the most probable scenario.
P.S. Check also the very consistent Resistance and Support levels on the RSI.
--------------------------------------------------------------------------------------------------------
** Please support this idea with your likes and comments, it is the best way to keep it relevant and support me. **
--------------------------------------------------------------------------------------------------------

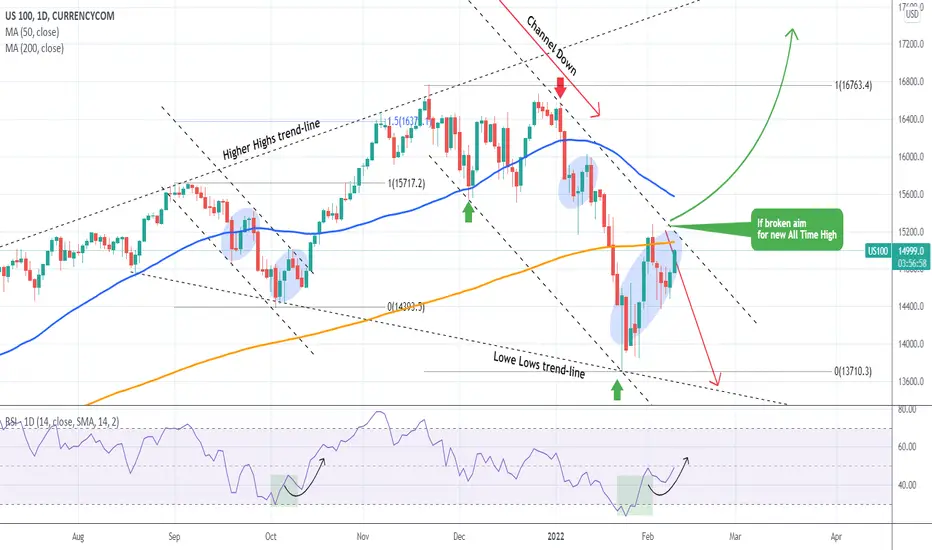
NASDAQ is about to break into long-term bullish territory again.Basically this is a quick update to my January 31 analysis on NDX where I made a case for the importance of this Channel Down:
Initially the price got rejected near the top (Lower Highs) trend-line of the Channel Down but since yesterday, it is staging a comeback. As mentioned before, a break above it, will most likely restore the long-term bullish trend on Nasdaq and will aim for new All Time Highs (potentially near the 1.5 Fibonacci extension long-term).
The finding of the current idea though, is that the current Channel Down resembles that of the previous correction during September 06 - October 13 2021. For a better illustration, see that Channel below on the 12H time-frame, where th MA50 and the MA200 trend-lines are similar to those of the current Channel Down on the 1D time-frame:
Breaking above the 1D MA50 this time, most likely confirms the above.
--------------------------------------------------------------------------------------------------------
** Please support this idea with your likes and comments, it is the best way to keep it relevant and support me. **
--------------------------------------------------------------------------------------------------------
NASDAQ Channel Down emerged. Trade the rejection or break-out.Nasdaq has suffered the most during January's correction. The Lower Lows created a new Channel Down which we have to consider, despite having the 1D RSI make a rebound from oversold levels and a bottom formation similar to early October, mid-May and early March 2021.
The 1D MA200 (orange trend-line) is the first natural Resistance. If the price gets rejected at the top of the Channel Down (Lower Highs trend-line), we'll have a sell signal targeting the Lower Lows trend-line.
On the other hand, a break above the Channel Down along with closing above the 1D MA50 (blue trend-line), will be a confirmation that the index has recovered the long-term bullish trend and will be a buy signal towards the Higher Highs trend-line with a rough technical target the 4.0 Fibonacci extension at 17515.
--------------------------------------------------------------------------------------------------------
** Please support this idea with your likes and comments, it is the best way to keep it relevant and support me. **
--------------------------------------------------------------------------------------------------------

NASDAQ RSI hit the long-term Buy ZoneNasdaq is giving a double long-term buy signal as besides the RSI on the 1D time-frame entering the Buy Zone that has been in effect since the March 2020 market crash, the price itself hit the Higher Lows trend-line that has been holding since the November 2020 U.S. elections bottom. The 1D MA200 (orange trend-line) is right below as it was on all 3 major bottoms of 2021 (March 05, May 13, October 04).
We expect the Channel Up top again around 18000 (1.786 Fibonacci extension) by the end of March.
--------------------------------------------------------------------------------------------------------
** Please support this idea with your likes and comments, it is the best way to keep it relevant and support me. **
--------------------------------------------------------------------------------------------------------

NASDAQ testing the 1D MA50. Buy opportunity.I haven't updated my NDX outlook since December 17 but so far it appears to be trading according to plan after accurately catching that bottom:
Today the index made contact with the 1D MA50 again (blue trend-line) and that's a pattern we've seen before twice within this multi-month Channel Up on the chart.
As you see, every time Nasdaq approaches the previous High (Fib 1.0) following a Channel Up bottom, the price pulls back to the 1D MA50 (orange circle) and then the rise continues all the way to the 1.786 Fibonacci extension. As a result, we treat this pull-back as a mid-term buy opportunity, especially for those who missed the December bottom. Our target is 17600.
--------------------------------------------------------------------------------------------------------
** Please support this idea with your likes and comments, it is the best way to keep it relevant and support me. **
--------------------------------------------------------------------------------------------------------

NDX Nasdaq 100 Santa Rally?The Santa Rally is set to start on Monday, Dec. 27.
This period gave positive return for the S&P 500 78.9% of the time.
Since 1950, the average return of the Santa rally was 1.33%.
How do you think this will be reflected in the Nasdaq 100 index?
The reasons could be optimism over the new year ahead or holiday spending.

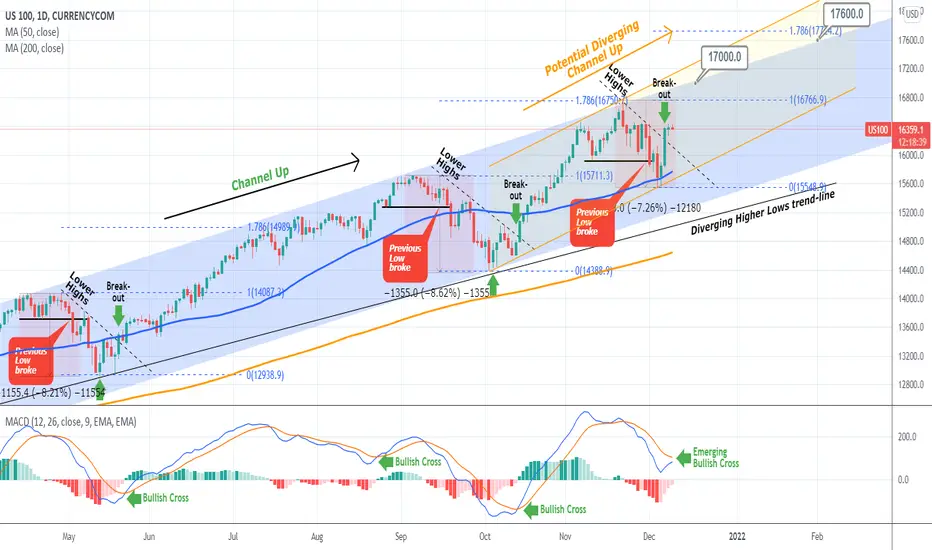
NASDAQ may break even higher than its Channel UpAs mentioned on my previous analysis, the Lower High divergence on the 1D RSI was the signal that Nasdaq would pull-back. The small technical correction eventually ended at around -7% from the top, exactly on the 1D MA50 (blue trend-line). As I've mentioned before, this is generally considered a solid first buy entry.
The current chart shows that after a similar correction (8 to 8.50% roughly), NDX always starts a 2 month rise towards the 1.786 Fibonacci extension. The point of bullish break-out is typically when the 1D MACD forms a Bullish Cross, which is currently close to happening. Previously that has coincided with the break above the internal Lower Highs trend-line.
The 1.786 Fib extension is currently a little over 17700. If that takes place within the next 2 months, we may see the dominant 9-month Channel Up break upwards and transcend into the Diverging Channel Up displayed in orange. Regardless of that, our next two long-term targets are 17000 and 17600.
--------------------------------------------------------------------------------------------------------
** Please support this idea with your likes and comments, it is the best way to keep it relevant and support me. **
--------------------------------------------------------------------------------------------------------
NASDAQ resisting the selling pressure. Well supported for now.This is an update on my previous Nasdaq analysis where I called for potential further rise within a narrower Channel Up at the top of the longer-term Channel before a new technical correction comes:
So far this view has been confirmed as the Support of the previous Low (bold black line) is holding. See the similarities between now and the mid July - August Channel Up. The RSI sequences are almost the same following an identical RSI bearish divergence on Lower Highs. That should ultimately lead to a blow-off top around 17000.
If the small Channel Up breaks downwards and cracks the previous Low, I expect NDX to seek the 1D MA50 (blue trend-line) and if that doesn't hold either, possibly make a Low on the bottom of the 9-month Channel Up or even the Diverging Higher Lows trend-line.
Trade accordingly and with caution as Friday's Nonfarm Payrolls report is very likely to shape the fundamental landscape of this month with regards to the Fed's taper program.
--------------------------------------------------------------------------------------------------------
** Please support this idea with your likes and comments, it is the best way to keep it relevant and support me. **
--------------------------------------------------------------------------------------------------------

NASDAQ The level that has to holdNasdaq is ahead of critical crossroads as the Lower Highs on the RSI on the 1D time-frames show a bearish divergence against the Higher Highs of the actual price.
When the 1D RSI formed this sequence in the past, the index dropped at least -8% but only if the previous Low broke (black support). In mid July the Low held and Nasdaq continued on a small Channel Up towards one last Higher High before eventually correcting -8%.
As a result, I expect a Higher High as long as the previous low holds. If broken then a bottom on the Diverging Higher Lows trend-line is possible. In either case the next bullish target is 17000.
--------------------------------------------------------------------------------------------------------
** Please support this idea with your likes and comments, it is the best way to keep it relevant and support me. **
--------------------------------------------------------------------------------------------------------

NASDAQ 4H Golden Cross aims at 16300 long-termMy most recent Nasdaq post was a buy signal on the 1D MA50:
Currently we have a buy continuation signal for the long-term towards the 1.5 Fibonacci extension (16300) with a potential short-term pull-back to add more longs on the 0.5 Fib retracement or the 1D MA100 (red trend-line). This is based on the May - June fractal whose pattern is so far following in great detail the current price action.
--------------------------------------------------------------------------------------------------------
** Please support this idea with your likes and comments, it is the best way to keep it relevant and support me. **
--------------------------------------------------------------------------------------------------------
