Nasdaq-100 (NDX) Weekly Chart 2025 Chart Context
This weekly timeframe analysis of the Nasdaq-100 Index (NDX) forms a key pillar in our 2025 macro analysis series. Following the breakout structure seen in TOTAL, TOTAL2, BTC.D, and US10Y, this chart utilizes 2 Fibonacci tools (1 trend-based extensions and 1 retracement) to project potential corrective and expansion scenarios.
Fibonacci Tools Used:
Fibonacci Retracement : Applies to the recent smaller swing to determine micro retracement zones and cluster supports.
0=20674 and 100=10504
Trend-Based Fibonacci Extension: Drawn using a three-leg structure (point A= 3993 to B=16724 to C10504) to forecast upside targets beyond ATH.
All take-profit (TP) levels: TP1 (~23,400), TP2 (~26,700), and TP3 (~30,344.49)—are located at confluence zones where Fibonacci levels from different tools align, reinforcing their validity and strength.
There is a 4TP above all the Visible TPs
Key price references:
0% retracement: ~20,674.71
Next Resistance ~23,400 (confluence of extensions and psychological resistance)
Projected TPs:
1TP=~23,400,
2TP=~26,700,
3TP=~30,344.49,
4TP=44000
Support/Resistance:
Red zone: ~16,700–18,300 (historical S/R and correction target and Fib Confluences)
Resistance zone: ~23,000–23,400 ,
22000(ATH area)
Key Technical Observations:
Fibonacci Retracement from ~20674 to ~15732 marks the initial corrective range.
Trend-Based Extensions forecast:
TP1 (~23,400): First breakout resistance
TP2 (~26,700): Medium-term expansion zone
TP3 (~30,344): Long-term target if macro tailwinds persist
Scenario Pathways:
Bullish Continuation: Breaks above ATH to reach TP2/TP3
Healthy Correction: Pullback to ~20,600 or deeper ~18,300 before resumption
Deep Correction: Revisits ~16,700 zone if macro environment deteriorates
Fundamental Context:
Tech Stocks & Economic Sentiment: NDX is often the first to move during liquidity expansions. Its performance signals risk-on behavior across global equity markets.
Rate Cuts in 2025: With anticipated Fed rate cuts, tech stocks are primed for inflows. Forward earnings valuations rise, justifying extended upside in high-beta tech.
AI Boom & Earnings Growth: Nasdaq is heavily weighted toward AI, cloud, and semiconductors—sectors expected to lead earnings surprises.
NDX Influence on Gold and Crypto
When NDX rallies:
Crypto: Risk appetite improves. Capital rotation flows into altcoins and layer-1 assets.
Bitcoin: Often sees parallel inflows, especially during strong tech rallies (e.g., 2020).
TOTAL & TOTAL3: Begin breakout patterns if NDX continues to surge.
Gold: May stall or correct as investors favor risk assets. However, gold still holds due to macro hedging and real yield pressures.
When NDX corrects:
Crypto: Volatility spikes. Altcoins bleed faster.
Bitcoin: Short-term dip but may decouple if viewed as digital gold.
Gold: Benefits from flight-to-safety behavior.
US10Y: Often reacts inversely to NDX moves—used for confirmation.
Search Highlights (2024–2025):
Institutions view NDX correction as signal to rotate into commodities (incl. gold).
Cross-market correlations show NDX peaks often precede crypto mini-rallies.
De-risking from NDX often triggers gold strength, especially in geopolitical or inflationary backdrops.
Bias & Strategy Implication
Primary Bias: Bullish
Expecting upside continuation to 26,700–30,000 zone
Multiple correction opportunities are present even during rally
Strategic Actions:
Monitor for correction to yellow/red zones for accumulation
Use NDX behavior as leading macro signal for crypto rotations
Watch resistance at 23,400 closely; breakout confirms trend extension
Time Horizon
Short-Term (1–2 months): Watch for breakout or correction to ~20,600–18,300
Mid-Term (3–6 months): Probable test of ~26,700
Long-Term (6–12 months): Potential expansion to ~30,344.49
Ndxusd

NASDAQ 100 Sinks on AI Cost Woes - Full Target Breakthrough HIT!NASDAQ 100 (NDX) Analysis using Risological Swing Trader:
In the 15-minute timeframe, NASDAQ 100 (NDX) demonstrated a powerful bearish move, with all targeted profit levels being achieved in a swift drop. This short trade setup showed significant follow-through as investor sentiment shifted negatively due to concerns over escalating AI expenses reported by Wall Street's megacaps.
Key Highlights:
Entry Level: 20,429.42
Target Levels:
TP1: 20,323.94
TP2: 20,153.26
TP3: 19,982.58
TP4: 19,877.10
Stop Loss: 20,514.76
Context:
This bearish momentum aligns with Wall Street’s close on a lower note as major tech giants highlighted rising costs linked to AI developments. The day's range fluctuated between 19,880.26 and 20,227.19, underscoring the volatility and risk aversion among investors. The setup capitalized effectively on this negative sentiment, reinforcing the bearish outlook.
Summary:
This trade on NASDAQ 100 hit all targets with precision, benefiting from the broader market's reaction to heightened cost pressures in the tech sector. This downward move underscores the impact of macroeconomic concerns on equity performance, particularly in high-cost sectors like AI.

Nasdaq_NDXUSD_2HHello 👋
📊Nasdaq index analysis in 2 hours short and medium term based on Elliott waves Due to the failure of the upward trend line, the market can complete its ascent in 5 waves, which is currently corrected in the 4th wave. Support wave 4 18230 Target wave 5 range of number 18600

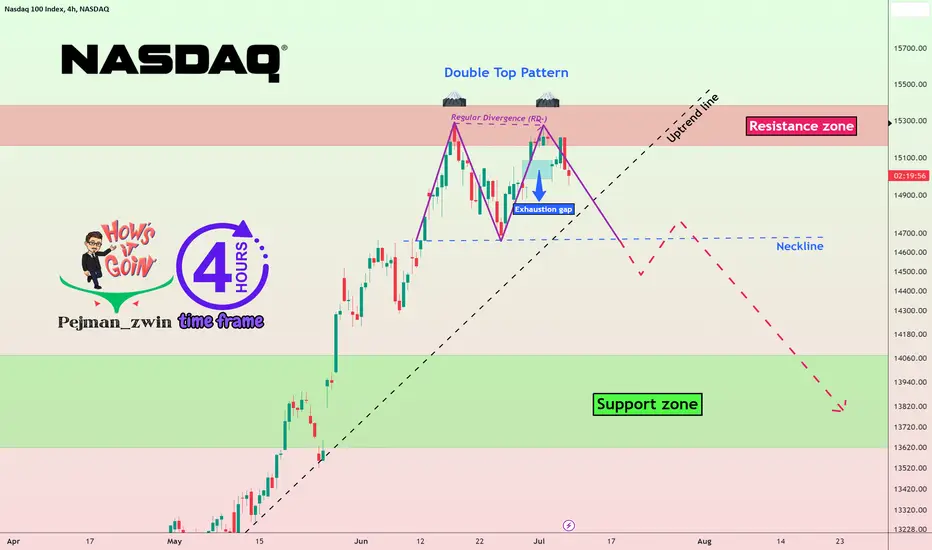
Nasdaq crash by🗻Double Top Pattern🗻Nasdaq is moving near the 🔴 resistance zone(15,385-$15,160) 🔴, and the formation of an Exhaustion gap can be a 💡 Sign 💡 of the end of the upward trend of the Nasdaq these few weeks.
Also, due to the Regular Divergence(RD-) between two consecutive peaks, the possibility of forming a 🗻 Double Top pattern 🗻 is very high.
🔔I expect the Nasdaq to fall to at least the 🟢 support zone($ 14,060-$ 13,610) 🟢 after breaking the uptrend line and neckline .
Nasdaq 100 Index Analyze (NDXUSD), 4-hour time frame⏰.
Do not forget to put Stop loss for your positions (For every position that you want to open).
Please follow your strategy, this is just my Idea, and I will be glad to see your ideas in this post.
Please do not forget the ✅' like '✅ button 🙏😊 & Share it with your friends; thanks, and Trade safe.
NDX are you rdy for long ?🧨🧨👌Nasdaq index, did you know that this index has an upward trend in the past two weeks? Well, interestingly, Bitcoin also has and I announced this in my analysis.
Well, how far the index should go up, you should be careful, I won't say here if it goes up.
Two more targets will not be seen, the first target is 15265.42, the index will go up to this price.
Our second target is 16607.19. I am giving you this information based on the method of dirty banks, so don't forget that this index is bullish to see these targets.

NDX is trading in Supply zone for 2nd week nowThe main resistance is at 12805 to 12900
There is an extension to 13500, in case it wants to extend.
Biden is travelling to Poland on the 20th, and it's a long weekend.
There are some rumours about Poland attacking Belarus before the 25th.
Something big is coming from now till July of this year.
This high in Feb/Mar might be "the high" for the year...
Have a great week

NDX/USD Ascending TriangleNasdaq is moving by forming a triangle pattern . 12180 is the resistance now. Nasdaq will test 11600 and then moves towards Resistance.
Buy above 12180

NDX/USD Its just an idea nothing else.ndx forms a W Bullish pattern. at point 1st buy it retested its spot and boom. lets see what happens next

NAS100 [US100] Daily Outlook | 15-JuneHi Team,
Is NAS gonna continue dipping? Or Perhaps it's time for some ranging
We will find out soon enough.
Follow me, like my posts, and share with your friends.
Live Trading/Streaming at 8:45AM EST (Mon-fri)
Kings.

NAS100 [US100] Daily Outlook | 10-JuneHi,
Here is what am looking at today. Yesterday was a success, we made +350pips profit after i called the trade during my live trading yesterday.
Let see what happens.
Kings

NAS100 [US100] Daily Outlook | 1-JuneWelcome to JUNE Amigos!
Here is what am looking at today.
made +100pips✅ (before NYSE open)+80pips ✅(Live trading during NYSE Open) yesterday.
See you all during today's live streaming (8:45AM EST)
I will update intermittently.
Kings.

NDX Collapse ScenarioUsing Fib circles to plot how price falls
Both corrections are around -80%
A fall like this allows for a third touch on the up channel that is apparent
Bars pattern placed (red) is just my thoughts of how price could act if this scenario occurs

NDX W-Shaped RecoveryI think we might see the end of the war soon.
Russia says the first phase of its “military operation” in Ukraine is mostly complete.
I am considering a W-Shaped Recovery on NDX and a price target of $15670.
Looking forward to read your opinion about it.

NASDAQ 100: everything bullish?The Nasdaq 100 was initially able to continue its upward trend up to a record high of 15,002 points. There, a bearish Doji in the daily chart initiated a setback on July 13th. At the start of the week, the index formed a correction low at 14,455 points. Since then, the technology-heavy index has only known the way up. After four plus days in a row, it finally marked a new all-time high of 15,126 points on Friday.
Bull market confirmed
The overriding bull market was thus formally confirmed. We see potential next price targets from the Fibonacci analysis at 15,151 / 15,211 points, 15,340 points and 15,549-15,581 points. We would see a first warning signal for the bullish scenario in a significant daily close below the support at 15,000 / 15,002 points. In this case, Friday's outbreak would have turned out to be a false outbreak.
Warning signals
In view of the overheated and sometimes bearish diverging technical market indicators, the weak market breadth, the sentiment indicators signaling euphoria and the seasonality that will deliver headwinds from August, we consider the probability of a pronounced medium-term correction phase to be still high. Below 15,000 / 15,002 points, downside risks would arise in the direction of initially 14,320-14,455 points. Below that, a continued setback in the direction of 13,773 / 13,844 points would be indicated. From today's perspective, this would not jeopardize the overall upward trend.
Note:
Despite careful analysis, Global Investa accepts no liability for the content, topicality, correctness or completeness of the information provided. The information provided does not constitute investment advice, purchase recommendations or investment brokerage.

NASDAQ - Elliott Wave CorrectionShort Term Bearish to complete the 5th wave of ABC correction.
- Happy Trading.

#Nasdaq - Be careful #NDX #NDX100The month of March and the first quarter of 2021 are coming to an end and there is a possibility of an April correction. Not in every market, but at least for the Nasdaq100, I can't argue it away at the moment.
The RSI has a double divergence and signals weakening momentum.
Therefore, in my opinion, we should wait for the end of the month and the end of the quarter before making further purchases. Not that someone gets angry because in 4 weeks there is a discount on the same Stocks of over 16 percent.
Therefore - be careful and watch out.
Greetings from Hanover
Stefan Bode

NDX/US30 - SHORT; SELL this extreme "rotation" in US equities!!Most likely a Crash.
Here is the Nasdaq100
from this post
Here is the DJIA

NASDAQ - Clear divergence and drop againWe have a good paralel channel on NASDAQ that we are moving in, but we have to clear out the divergence first, so we will see just a little bit more upside and then continue downard.

NDX - Upward trend correctionRSI - You can also see divergence here from the last top 27th August.
Looking for a short term drop back to ~11530 area
