NEAR Breakout Confirmed—But Is This Just a Bull Trap?Yello Paradisers! Did you see that breakout on #NEARUSDT? After weeks of consistent lower highs and a clearly defined descending resistance, price action has finally snapped that bearish structure and completed a textbook inverse Head and Shoulders formation on the 12H chart. This kind of pattern doesn’t appear often at key cycle points, and when it does—especially with confirmation—it becomes a high-probability signal of a trend reversal.
💎#NEARUSDT ,The neckline of the inverse H&S, sitting around the $2.17–$2.23 zone, has now been broken and crucially retested as support. This means the former resistance is now acting as a probable base for bulls, and if price remains above this area, the market is likely preparing for a strong probable impulsive move to the upside.
💎The structure shows clear bullish intent, and from a technical perspective, the first resistance comes in at $2.72. A clean break above that could open the door toward the major resistance zone between $2.97 and $3.05, which would complete the projected breakout target of the H&S pattern.
💎If bulls manage to maintain control above the $2.17–$2.23 support zone, we expect price to slowly build momentum toward $2.72, with increased volatility likely once that level is tested. Should that break occur with volume, the next leg may extend rapidly into the major resistance zone. However, if price fails to hold above this flipped support zone, we will be closely watching the $2.02–$1.89 area as the last major support before invalidation.
💎A daily candle closing below $1.798 would invalidate this entire bullish thesis and put the market back into a neutral-to-bearish range.
💎Adding more probability to this setup, NEAR is now trading above multi-timeframe EMA on higher time frame. This multi-timeframe EMA alignment supports bullish continuation, as momentum begins to shift in favor of buyers. However, continuation depends heavily on how price reacts at each resistance level—especially as we enter the mid-$2.70s.
💎The probable move from here is bullish, with the expectation that NEAR pushes toward the $2.72 level in the short term, followed by a potential rally to $2.97–$3.05 if momentum sustains. This scenario remains valid as long as price holds above $2.17, and especially above $2.02. Below that, the structure weakens. Below $1.798, the bullish bias becomes fully invalidated.
This is the only way you will make it far in your crypto trading journey. Stay sharp and patient, Paradisers. It’s not about chasing pumps—it’s about positioning smartly before the crowd.
MyCryptoParadise
iFeel the success🌴
Nearprotocol

NEAR Protocol New All-Time High & Targets (PP: 1,108% Minimum)Here we have the same signal we just looked at in another publication, a break and close daily above EMA55 & EMA89. The bullish bias is confirmed.
The blue dotted line stands for EMA89 while the magenta one is EMA55. Once the action moves above daily, mid- to long-term growth is confirmed. Mid-term bullish above EMA55 and long-term bullish above EMA89. Near Protocol is bullish now.
NEARUSDT Technical analysis
On the main chart above we can see a peak March 2024 and a lower high in December of the same year. This means very strong, prolonged bearish action. After a strong bearish cycle comes a strong bullish cycle, the market tends to fluctuate, always fluctuating between bear and bull.
When the market is down, no need to worry because it will eventually grow.
When the market is up for a long while, watch out because a correction can develop anytime out of nowhere.
The cycles repeat over and over, again and again; forever, just like night and day. Winter, summer, spring and fall, the seasons. Everything in nature is cyclical, the market is no exception. We can use this information to our advantage, we know for certain that we are now entering a major growth phase because of the cyclical nature of the market.
The next high will be a major high compared to March 2024, and possibly a new all-time high compared to April 2022 which is the highest level on this chart. If you want to see bigger projections, go to my profile and search for NEARUSDT. You will find there everything you need.
NEAR Protocol new all-time high & targets
The first target is $12 for 368% profits potential. I don't count $5.77 because that is one of the easy targets. It is a shame to sell too early when prices are going really high-up. The $12 target would be the highest price in more than 3 years, since May 2022. This is the first higher high but not the end, the market is very likely to move higher, much higher.
The next target $18.6 for 615% profits potential. This is a good target to start. We then have $25 and $31 for a maximum of 1,108%. We should hit all of these targets within the next 6 months (6-8 months to be safe).
Patience is key. Buy and hold.
Thanks a lot for your continued support.
Namaste.

NEAR/USDT – Breakout in Progress? Watch This Zone CloselyNEAR is attempting to break out of a long-standing descending triangle. After a previous fakeout near the $2.70 zone, the price is again testing the upper trendline with strong momentum.
Chart Overview:
Price crossing the resistance of the descending structure.
Strong support held at $2.01 and $2.24 zones.
Volume is gradually increasing on breakout attempts.
RSI pushing higher, indicating building bullish momentum.
Trade Setup (on Break & Retest):
Entry: Wait for breakout and retest around $2.24–$2.28 zone
Stop Loss: Below $2.01
Targets:
Target 1: $2.44
Target 2: $2.70
Target 3: $2.97
Risk-Reward Estimate:
Approximately 2.5–3.5x RR depending on retest depth.
If NEAR reclaims $2.44 with conviction, this could trigger a sustained move toward $3+.
Watch BTC stability before entering.
DYOR | Not financial advice

TradeCityPro | NEAR Faces Resistance in Lower Range Zone👋 Welcome to TradeCity Pro!
In this analysis, I’m going to review NEAR, one of the AI and Layer1 crypto projects, currently ranked 35 on CoinMarketCap with a market cap of 2.77 billion dollars.
📅 Daily Timeframe
On the daily chart, NEAR has formed a large ranging box between the 1.884 and 3.548 levels and is currently positioned in the lower half of that range.
✔️ After hitting the lower boundary, the price has formed a trigger around the 2.279 level and is now fluctuating below it.
✨ A breakout above this level could give us a long entry. However, the downside is that volume is decreasing and diverging from price. If this volume drop continues, the likelihood of the range breaking to the downside increases.
📊 If volume starts to rise, considering that the RSI is stabilizing above the 50 zone, the probability of a bullish scenario becomes much stronger.
💥 The main resistance above the current price is at 3.548, which I’ve marked as a zone. In my opinion, breaking this level would be the main trigger for a spot buy, and I personally plan to wait for this level to break before buying spot.
🔔 If the price gets rejected from the 2.279 level and bearish momentum enters the market, a break below 1.884 would be a strong short trigger and could signal the start of a new bearish leg and continuation of the previous downtrend.
📝 Final Thoughts
This analysis reflects our opinions and is not financial advice.
Share your thoughts in the comments, and don’t forget to share this analysis with your friends! ❤️

YOLO Near USDT is a stellar buy here HUGE UPSIDELast cycle we saw a large correction to these levels before seeing a huge altcoin season. I believe we will see another run this cycle.
Near is a entry between $1.90 and 1.60.
Sell targets 8 20% sell
$12 20% sell
$16 20% sell
$20 20% sell
20% sell: Let it rideeeee to euphoria

Breakout Watch: NEAR Approaching Moment of Truth If you want, ICBOE:NEAR is currently testing the breakout zone but is still holding below the key trendline.
It’s a critical spot — if NEAR manages to break and close above this trendline, it could unlock further upside. For now, the trendline remains intact, so patience is needed here.
Watching closely to see if the breakout gets confirmed or if we see another rejection.
DYOR, NFA

TradeCityPro | NEAR: Key Support Battle in Layer 1 AI Protocol👋 Welcome to TradeCity Pro!
In this analysis, I’m going to review the NEAR coin for you — one of the prominent AI-focused and Layer 1 protocols that has gained significant attention in recent years.
🔍 This project’s coin, with the ticker NEAR, currently holds a market cap of $2.94 billion, ranking 34th on CoinMarketCap.
📅 Daily Timeframe
As you can see in the daily timeframe, there is a very strong support level at 2.239, which has been tested multiple times. The price has once again reached this zone.
✨ If this level breaks, the price could drop toward lower supports such as 1.694. Therefore, a break below 2.239 would be a valid trigger for a short position.
💫 The trendline drawn on the chart is also a significant level. If 2.239 is broken, price could potentially react to this trendline as well.
💥 If price holds this support and attempts a bullish move, we can open a long position upon breaking 2.653.
📈 The main long triggers, including potential spot buying, are at 3.355 and 3.548. If these levels are broken, NEAR could begin a strong uptrend toward targets at 4.726 and 7.998.
📊 Currently, market volume is ranging — buyers and sellers are evenly matched. We need to wait and see which side gains dominance to follow the momentum.
✔️ On the RSI oscillator, entering the Oversold zone would confirm a short setup, while breaking above the 50 RSI level would confirm a long setup.
📝 Final Thoughts
This analysis reflects our opinions and is not financial advice.
Share your thoughts in the comments, and don’t forget to share this analysis with your friends! ❤️

NEAR Protocol Can Hit $35 or $52 in 2025 (PP: 2,000%+)Back to what I was doing... NEAR Protocol (NEARUSDT) closed red three weeks and this week is the fourth week with the action being bearish, why am I bullish?
Four weeks of bearish action and there isn't much, well, bearish action. Total drop is less than 30%. If you look back to January, or say May 2022, four weeks red would be something completely different; market conditions are not the same.
The market now is not bearish nor crashing so we are only seeing a retrace, a retrace is a small correction that ends in a higher low. Wait, let me make a long story short, NEAR Protocol is set to grow.
The market bottom in October 2023 is much, much lower compared to the low hit April 2025, much lower. So we have a very, very strong higher low. This only reveals something we already know, NEAR is bullish and bullish means up. Prepare for growth. The 2025 targets can be seen on the chart.
» How likely is a new all-time high in 2025?
Probabilities are really, really high. NEAR Protocol has a very strong chart that points to a long-term higher high next. The ath being $20, it can easily go higher thanks to the strong higher low mentioned above.
» How long will it take for this new ath to be hit?
Can be anywhere between 4-8 months. I know it is a wide range but with thousands of altcoins, some will move first while others will take longer to reach their bull market top. But late 2025 is the main date and some altcoins will continue bullish through early 2026.
Yes, this pair can be approached with leverage.
Low leverage is better. Low risk is better. Spot is best.
Thanks a lot for your continued support.
Namaste.

NEAR NEAR NEAR Hello friends
Considering the good growth we had, you can see that the price has corrected after reaching its ceiling.
Now, with the price correction, there is a good opportunity to buy in stages and with capital management and move towards the specified goals.
*Trade safely with us*

NEAR Protocol price analysisIt's really hard for CRYPTOCAP:NEAR to grow now....
If we look at the wave analysis, we can assume that the OKX:NEARUSDT price could drop to $2.30-2.50 once again.
And from there, with renewed vigor, it will start upwards to break out of the protracted falling channel above $4.50
_____________________
Did you like our analysis? Leave a comment, like, and follow to get more

NEARUSDT Retest in Play After Breakout — Bulls May Take Charge!BINANCE:NEARUSDT has turned the tide after a prolonged downtrend, now forming higher highs and signaling a shift in momentum. Recently, it broke through a key resistance level, flipping it into support, a classic breakout-retest setup. Right now, price action is retesting that breakout zone, and if it holds, we could see a strong bounce and continuation of the bullish structure. This level is crucial, and a successful retest could pave the way for another leg up.
As always, don’t forget to manage your risk. keep a well placed stop loss in case the market flips unexpectedly.
BINANCE:NEARUSDT Currently trading at $2.8
Buy level : Above $2.75
Stop loss : Below $2.2
Target : $5.5
Max leverage 3x
Always keep stop loss
Follow Our Tradingview Account for More Technical Analysis Updates, | Like, Share and Comment Your thoughts

#NEAR/USDT#NEAR
The price is moving within a descending channel on the 1-hour frame, adhering well to it, and is heading for a strong breakout and retest.
We are experiencing a rebound from the lower boundary of the descending channel, which is support at 2.90.
We are experiencing a downtrend on the RSI indicator, which is about to break and retest, supporting the upward trend.
We are looking for stability above the 100 Moving Average.
Entry price: 2.94
First target: 3.03
Second target: 3.14
Third target: 3.30

NEAR Protocol Easy Targets Up To 482%We just looked at Cardano and Binance Coin. See how different this chart looks. The large cap. projects have a pattern while the mid-cap. have a completely different one. The bigger cycle affects all the pairs in the same way but the charts are drawn differently, that is, a bear market will produce a decline on all projects at the same time but some will hit new lows while others will remain at support and so on.
So a bull market will produce growth all across but some will grow 10,000% while others only grow 500%. Some will hit new All-Time Highs while others will peak very low compared to their ATH.
Here, NEARUSDT, the bottom is confirmed through the higher low. The low followed by a higher low and then the continuation. The continuation is what seals the deal. We knew beforehand that the bottom was in but from a technical standpoint, the move 8-May and the chart as it is now is what confirms the bottom. With the bottom confirmed, we can look UP!
On the chart, these are all easy targets, even the higher ones.
Namaste.

NEAR Breakdown Confirmed! More Blood Before the Reversal?Yello, Paradisers! Is #NEAR about to drop even lower, or is a major reversal brewing? Let’s break it down!
💎#NEARUSDT recently suffered a descending triangle breakdown, sending prices tumbling lower. Adding to the bearish pressure, we’ve also got a death cross formation, reinforcing the weakness in price action. Right now, before NEAR can find any long-term bottom, the probability of further downside remains high.
💎The bulls are currently struggling. Multiple resistance levels are blocking any attempts to gain momentum, with all EMAs currently sloping downward—not a good sign for any immediate recovery.
💎NEAR is expected to slowly bleed into the long lower wick of February 3rd. Strong support exists between $2.65 and $2.40, a key demand zone that could trigger a bullish reversal. But if sellers continue to dominate, they could overpower this level and drive prices down further toward $2.05 - $1.95. This is a major higher time frame support zone, where a long-term reversal could finally take shape.
💎For the bulls to negate this growing pressure, they must break above $4.50—a critical level reinforced by both horizontal and descending resistance. If the price secures a bullish breakout above this, NEAR could be in a prime position to rally over the next few months.
Paradisers, as always, patience and precision are key in this market. This isn’t a time for reckless trades—let the levels guide you, trade strategically, and stay disciplined.
MyCryptoParadise
iFeel the success🌴

#Near Ready For a Major Breakdown? Let's Breakdown Key Levels Yello Paradisers! Is #NEAR about to trap thousands of traders chasing this last move up, only to reverse and flush hard? Let’s take a closer look at the #NearProtocol setup:
💎#NEARUSD is trading at $2.585, slowly grinding higher within a clearly defined Ending Diagonal structure. This textbook formation often tricks even experienced traders into entering too early. The current wave count suggests we’re in the final leg, Wave 5 is still in play, but it’s unfolding suspiciously close to a heavy resistance zone, one that previously acted as strong resistance and rejected it.
💎This zone, sitting around the $2.80–$2.90 area, is the key pivot for this entire setup. The bearish structure would be invalidated if #NEAR manages to break and close above this resistance with conviction, especially backed by strong volume. That kind of breakout would suggest the market still has bullish momentum and could drive the price toward the $3.00 region or higher. However, without a convincing breakout, the odds are still skewed to the downside.
💎As long as the price remains under this critical resistance zone, the Ending Diagonal pattern remains valid, and history has shown how brutal the reversal from this structure can be. A failure to break out cleanly is likely to lead to a sharp and rapid decline. The first area of interest on the way down would be the $2.153 level, an important support that the price has reacted to in the past.
💎Should this level break, the door opens to a deeper correction targeting $1.819, where the Volume Profile begins to rise again and buyers have previously stepped in. Momentum indicators are also not aligning with the bullish case. The RSI is showing clear signs of weakening strength, failing to keep up with the price as the move extends into the final wave.
Play it safe, respect the structure, and let the market come to you!
MyCryptoParadise
iFeel the success🌴

NEAR protocol looking for a bottomNEAR PA is at an important level. Market sentiment and trends suggest that NEAR can start showing signs of a reversal. The momentum and trend oscillators are in confluence, but a CHOCH will add more confluence.
Full TA: Link in the BIO

Short Term NEAR (4H)Near has formed a reversed head and shoulders pattern while breaking up a downwards trendline. Also retest confirmed. As long as the level of 2$ is maintained, Near should go upwards through 2.4$ at least.
Use 1.78 as stoploss and enter long right here.
Thanks for reading.

Great Long Position (Spot Trade)Near protocol has been completed the supply & show powerful candlestick pattern from the reversal area to bounce back.

NEAR Protocol Hits Bottom —Cash Or Crypto?This is a short-term chart but here the candles dynamics that I showed you recently with the long-term linear charts is also present. While the bearish move has momentum, the candles are big. When this momentum is lost, wanes, the candles become really small.
The candles becoming small can reveal a transition phase. From bearish to bullish, a sideways period. The bottom is in and NEAR Protocol is set to grow next long-term. A bull market.
After the low in March, we have a lower low and bottom.
The lower low can be known as a bottom because bullish volume starts to rise. There is also a recovery right after this low is hit. This is a small recovery but the volume and marketwide action tells us the bottom is in.
We are not looking for a new All-Time High, just focusing on the fact that the bottom is in, once the bottom is in we can expect growth long-term. So this is a friendly reminder to let you know that NEARUSDT is now showing great entry timing and prices.
In a few days, or weeks, it will move up strong and trade 200-300% above the current level, to never move back below. If you are reading this now, you have the chance to get NEARUSDT before some 10-30X total growth.
There isn't much complexity in trading when you choose to buy when prices are low. This is a true buy and hold scenario, this time it will be many times better compared to late 2024. It will be the ride of a lifetime.
Thanks a lot for your amazing support.
By the time this bull market is over, Cryptocurrency will be established as the default medium of exchange all around the world.
"Here is your Pizza, would you like to pay cash or crypto?
Crypto! Of course!"
Namaste.

Short NEAR/USDT🔥 #NEAR/USDT
🔴 SHORT
🎲 Entry Zone 1: 2.076
🎲 Entry Zone 2: 2.097
✅ Take Profit 1: 2.038
✅ Take Profit 2: 1.987
✅ Take Profit 3: 1.921
✅ Take Profit 4: 1.850
✅ Take Profit 5: 1.737
(Extended if Momentum Persists)
❌ Stop Loss: Above 2.190
💱 Recommended Margin: 2.5% – 5%
🧳 Recommended Leverage: 5X – 15X
🧠 Narrative: NEAR is testing a supply zone at 2.076 – 2.097. A rejection here could spark downside toward the listed TP levels as sellers regain control.
📈 Market Context: Keep an eye on overall crypto sentiment and BTC’s trend; a broad market rally could negate this short bias, while renewed weakness may accelerate the move.
⚠️ Risk Management: Place stops above 2.190, size positions carefully, and stay alert for unexpected strength.
⚠️ Take Care of Risk Management for Your Account

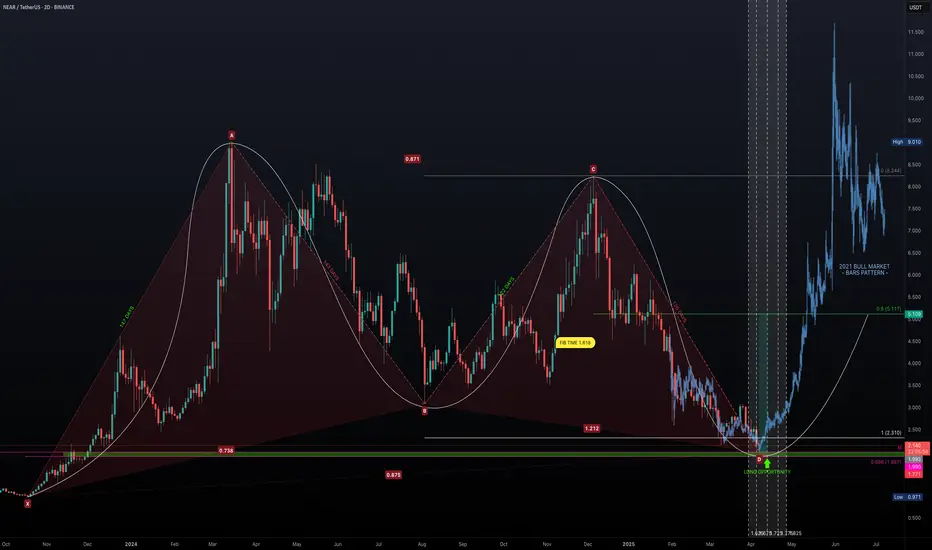
NEAR the Bottom? - The Crash Ends HereBack in October 2023, NEAR embarked on an incredible bull run lasting 147 days, surging from a low of $0.971 to a high of $9.01—an astounding +828% gain. Following this euphoric phase, the market sentiment shifted dramatically. Over the subsequent 392 days, NEAR retraced to around $2, marking a -78% decline. Now, with the market at a critical juncture, the question remains: when does the madness of the crash end, and can we finally see a reversal?
Harmonic Patterns & Fibonacci Confluence
Chart Pattern Analysis: The XABCD Framework
Using the XABCD pattern tool, we identify the following key points:
Point X: $0.971
Point A: $9.01
Point B: $3.076
Point C: $8.244
Point D: $1.978
Durations:
X-A: 147 Days
A-B: 143 Days
B-C: 122 Days
C-D: 126 Days
These durations show remarkable symmetry—with the up-move phases (X-A and A-B) nearly matching in time, and similarly for the correction phases (B-C and C-D). This time symmetry supports the presence of a harmonic structure, and the retracement levels help validate the potential for a reversal.
Fibonacci Implications
Fib Retracement of XA: Point B is at 0.738
Fib Retracement of AB: Point C sits at 0.871
Fib Retracement of BC: Point D lands at 0.875
Fib Extension of BC: Point D is at 1.212
While Point D’s retracement at 0.875 is slightly deeper than the classic 0.786 level expected for a Gartley Harmonic, it remains close enough to validate a harmonic correction, especially considering market noise. Additionally, the expansion of BC at 1.212 is close to the 1.27 range, lending further credence to this being a Gartley-type pattern.
Time Factor: Fibonacci Time Extensions & Exhaustion
147-day Bull Run: NEAR rose from $0.971 to $9.01 in 147 days.
392-day Bearish Correction: Since hitting $9.01, the price has retraced for 392 days.
Fibonacci Time Extensions:
1.618 multiplier: 147 × 1.618 ≈ 238 days. A Classic "golden ratio" reversal target. This period coincided with a +135% surge in November.
2.618 multiplier: 147 × 2.618 ≈ 385 days. High-probability exhaustion point. This is nearly equal to the current 392 days, suggesting that time-based exhaustion may be imminent.
The alignment of these time-based measures with the price retracement (approximately 87.5% retracement of the original move) signals a critical juncture where the bearish phase could soon be over.
Identifying the Support Zone & Long Opportunity
Based on harmonic and Fibonacci analyses, the confluence of key support levels points to a potential bottom:
Harmonic Point D: Trading near $2.
Monthly Level: $1.99 acts as a strong support benchmark.
Fibonacci Retracement (0.886): at $1.887.
These levels create a long opportunity window between $1.99 and $1.887. This confluence offers a solid entry region for long positions.
Additionally, other confluence factors include:
Fibonacci time extension at the 2.618 level (around 385 days) aligning with the current duration of the bearish phase.
The symmetry of the XABCD pattern adds to the reliability of the support structure.
High-Probability Trade Setup
Long Entry:
Entry Zone: Accumulate positions in the $1.99 to $1.887 range.
Target: Aim for the 0.5 Fibonacci retracement level of the bull run, approximately $5.00, which represents a potential +150% gain from current levels.
Risk-to-Reward (R:R): With the setup targeting a substantial rebound, the risk-reward ratio is very attractive, particularly if entry is taken in the defined confluence zone.
Market Outlook:
Current Sentiment: NEAR is in a significant downtrend, evidenced by a dramatic -78% retracement after an explosive bull run.
Reversal Indicators: The harmonic pattern, Fibonacci retracements, and time exhaustion (392 days approaching the 2.618 extension) all point towards a possible bottom formation in the coming month, particularly during April.
Potential Reversal: If NEAR holds within the $1.99 to $1.887 window, a reversal back towards $5.00 appears plausible, echoing the conditions seen at previous market cycle reversals.
Key Takeaways
Historic Run & Severe Correction: NEAR surged over +828% in 147 days only to retrace -78% over the following 392 days.
Harmonic Confluence: The XABCD pattern and Fibonacci levels create a compelling argument for a turnaround.
Time & Price Alignment: Fibonacci time extension around 385 days combined with an 87.5% price retracement suggests market exhaustion.
Solid Long Entry Zone: The support between $1.99 and $1.887 offers an attractive risk entry point with the potential to target a move back up to $5.00.
After decades in the trading arena, one thing is clear—the market often cycles through periods of euphoria and despair before turning a corner. NEAR's confluence of harmonic symmetry, Fibonacci retracement, and time-based exhaustion is almost too aligned to ignore. With a defined long entry window between $1.99 and $1.887, this might be the moment to consider a high-probability long trade. As always, manage your risk diligently and wait for clear confirmation.
Wrapping it up here, happy trading =)
If you found this helpful, leave a like and comment below! Got requests for the next technical analysis? Let me know.
WILL NEAR PROTOCOL MAKE IT ???According to current price action, Gartley Harmonic Pattern is formed on Near. Currently price is on it's PRZ. Also Near has reclaimed range low after sweep. If Near successfully breaks it's previous high, then we may see Near exploding upto Mid range & Range High targets easily.

NEARUSD Huge bullish divergence targeting $7.000NEAR Protocol / NEARUSD is trading inside a 1 year Channel Down.
The price is lately inside a smaller Channel Down that failed today and got rejected on the 1day MA50.
The 1day RSI howver has been on a Channel Up in the meantime, which is a huge bullish divergence and resembles the mid September 2024 rejection.
That was on the larger scale though a bottom for the Channel Down that initated a big rally to its top.
Buy and target $7.000.
Follow us, like the idea and leave a comment below!!
