NEAR Swing Long Idea - Altseason 2025📌 Fundamental Sentiment:
The entire crypto market is rallying, alongside other risk assets. This is mainly driven by U.S. policy expectations — Trump is pressuring Powell to resign and aggressively pushing for rate cuts from the Federal Reserve.
📌 Technical Analysis:
NEAR has recently broken and closed above a significant HTF support/resistance level.
Additionally, we’re now trading inside the 0.75 Fibonacci retracement level of the HTF bullish trend — which I define as the maximum discounted zone.
For this setup, I’ll apply my Deep Range Theory (DRT):
If price dips below the 0.75 zone and accumulates there,
Then breaks above 0.75 after a period of consolidation,
→ It signals that price aims for the 0.5 level of the range and will likely run HTF liquidity for either reversal or re-accumulation before continuation.
📌 Gameplan:
✅ Break and close above HTF S/R
⏳ Waiting for break and daily close above 0.75
🔄 Retest to LTF demand (4H–1H)
📈 A bounce on LTF demand will trigger the long setup
📌 Trade Management:
This is a mid-term swing trade, as I’m following the HTF bullish trend.
🎯 Target: $5 — which is approximately a +70% move from current price.
❗Risk Management:
If price makes a daily close back below 0.75 after breaking and closing above, I will exit the trade to preserve capital.
I’ll also monitor macro sentiment closely. If there's a sharp bearish shift, I may consider an early exit before reaching the HTF target.
—
🔔 Follow the channel for daily trade ideas & weekly macro recaps.
💬 Drop a comment below if you have any questions or insights!
NEARUSD

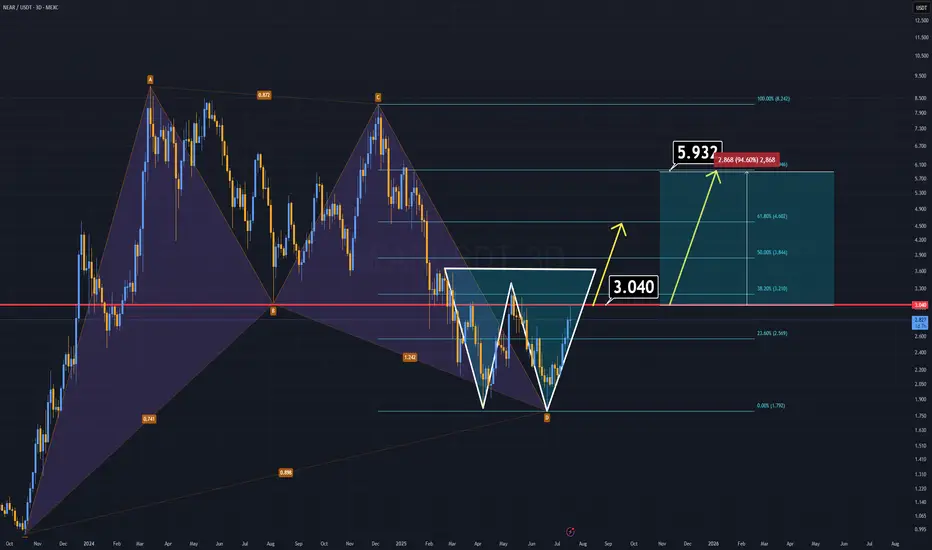
NEAR ANALYSIS (3D)NEAR Protocol has formed two strong bullish patterns and looks ready to climb, especially with the highly anticipated altseason on the horizon.
🔹 A harmonic structure from the previous cycle remains intact.
🔹 A double bottom formation is now clearly developing.
If NEAR manages to close a daily candle above the $3 level, we could see the price double in the short term.
On the fundamental side, NEAR is preparing for a vote to reduce its inflation rate. If the proposal passes, the circulating supply will decrease, potentially triggering a strong bullish run. As a leading AI-focused project, NEAR could spearhead the next wave of AI-related gains in the market.
(Read here for details):
www.near.org
All technical and fundamental signs point upward.
Thanks for reading.
$NEAR Local Still looks corrective..Though the CBOE:NEAR weekly looks good the same pattern on NEAR that I have highlighted here was also found on NYSE:FET and EURONEXT:RNDR local charts that has held these coins back from moving compared to others and appears corrective in nature and they all end at the daily 200EMA on bearish divergence.
Just something to look out for. A rejection in alts now could see fresh lows
Safe trading

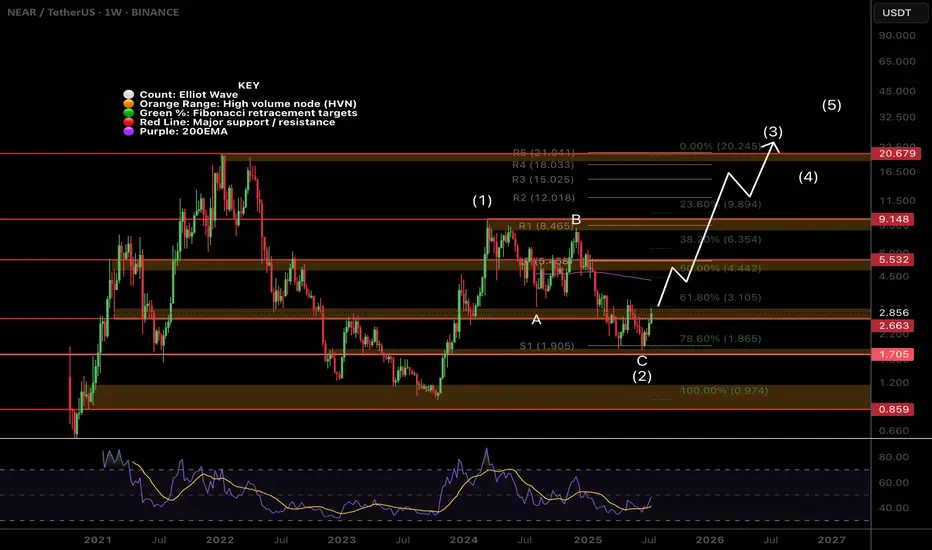
$NEAR Weekly TextBook Elliot Wave!CBOE:NEAR Weekly chart is a great demonstration of the text book motif wave followed by ABC corrective wave.
Bullish divergence has printed on the weekly RSI at the S1 weekly pivot support and the 'alt-coin golden pocket' 0.786 Fibonacci retracement. Price is closing in the major resistance High Volume Node.
The upside target is the newly printed weekly 200EMA followed by the weekly pivot and major resistance HVN just above $5.
A terminal target for this cycle may only see NEAR hitting all time highs around $21, the R5 weekly pivot point.
Safe trading
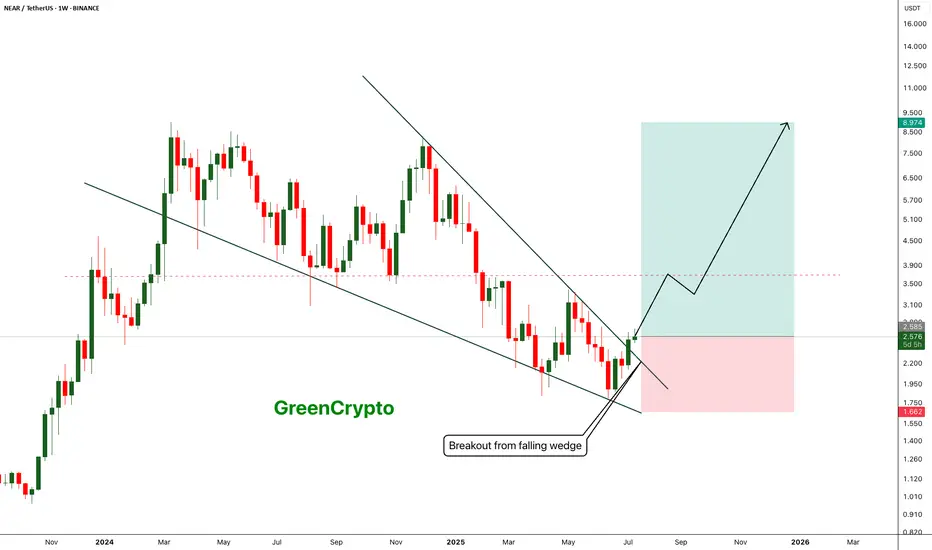
NEAR - Breakout from falling wedge pattern- Near has successfully broken out from the falling wedge pattern and now heading towards the next minor resistance around 3.6 range
- breakout from the minor resistance should push price towards the 9$ range
Entry Price: 2.57
Stop Loss: 1.66
TP1:2.935
TP2: 3.256
TP3: 3.986
TP4: 5.461
TP5: 7.102
TP6: 8.948
Stay tuned for more updates.
Cheers
GreenCrypto
NEAR Breakout Confirmed—But Is This Just a Bull Trap?Yello Paradisers! Did you see that breakout on #NEARUSDT? After weeks of consistent lower highs and a clearly defined descending resistance, price action has finally snapped that bearish structure and completed a textbook inverse Head and Shoulders formation on the 12H chart. This kind of pattern doesn’t appear often at key cycle points, and when it does—especially with confirmation—it becomes a high-probability signal of a trend reversal.
💎#NEARUSDT ,The neckline of the inverse H&S, sitting around the $2.17–$2.23 zone, has now been broken and crucially retested as support. This means the former resistance is now acting as a probable base for bulls, and if price remains above this area, the market is likely preparing for a strong probable impulsive move to the upside.
💎The structure shows clear bullish intent, and from a technical perspective, the first resistance comes in at $2.72. A clean break above that could open the door toward the major resistance zone between $2.97 and $3.05, which would complete the projected breakout target of the H&S pattern.
💎If bulls manage to maintain control above the $2.17–$2.23 support zone, we expect price to slowly build momentum toward $2.72, with increased volatility likely once that level is tested. Should that break occur with volume, the next leg may extend rapidly into the major resistance zone. However, if price fails to hold above this flipped support zone, we will be closely watching the $2.02–$1.89 area as the last major support before invalidation.
💎A daily candle closing below $1.798 would invalidate this entire bullish thesis and put the market back into a neutral-to-bearish range.
💎Adding more probability to this setup, NEAR is now trading above multi-timeframe EMA on higher time frame. This multi-timeframe EMA alignment supports bullish continuation, as momentum begins to shift in favor of buyers. However, continuation depends heavily on how price reacts at each resistance level—especially as we enter the mid-$2.70s.
💎The probable move from here is bullish, with the expectation that NEAR pushes toward the $2.72 level in the short term, followed by a potential rally to $2.97–$3.05 if momentum sustains. This scenario remains valid as long as price holds above $2.17, and especially above $2.02. Below that, the structure weakens. Below $1.798, the bullish bias becomes fully invalidated.
This is the only way you will make it far in your crypto trading journey. Stay sharp and patient, Paradisers. It’s not about chasing pumps—it’s about positioning smartly before the crowd.
MyCryptoParadise
iFeel the success🌴

$NEAR Disappointing so far...CBOE:NEAR is disappointing me as it continues towards the lows
Testing the .786 alt-coin golden pocket High Volume Node so should see a decent reaction from here as it appears a an ABC correction is complete after an Elliot wave motif wave.
Safe trading

NEARUSDT Breakout Watch Descending Triangle Reversal in Progress🧠 Pattern and Structure Analysis
The NEAR/USDT pair is currently displaying a long-term Descending Triangle pattern that has been developing for over 6 months. While descending triangles are typically bearish continuation patterns, a breakout to the upside often signals a strong trend reversal.
Descending resistance trendline: Multiple touchpoints confirming the structure.
Horizontal support zone: Strong base formed between $1.79 – $2.21.
The current price action shows a potential breakout above the descending resistance, indicating a possible shift in trend.
🚀 Bullish Scenario
If the breakout is confirmed (especially with high volume and daily close above the trendline), NEAR could rally toward the following resistance levels:
1. Target 1: $2.693 – minor resistance
2. Target 2: $3.021 – key psychological and technical level
3. Target 3: $3.568 – previous support/resistance flip
4. Target 4: $4.635 – major resistance zone
5. Extended Targets: $6.028 and $8.062 – historical highs
📌 Breakout confirmation requires a daily close above $2.25 with increased volume.
🐻 Bearish Scenario
If the breakout fails and the price gets rejected at the trendline:
Price may revisit the strong support zone around $1.79.
A breakdown below this support would open the door to deeper downside levels, possibly below $1.70 or even toward $1.50.
The bearish outlook would be invalidated if the price sustains above $2.30 and forms a higher-high structure.
🔍 Strategic Summary
Pattern: Descending Triangle (Potential Reversal)
Breakout Level: ~$2.25
Key Support: $1.79 – $2.21
Recommendation: Watch for a confirmed breakout with strong volume. Use a trailing stop strategy to lock in profits as targets are reached.
#NEAR #NEARUSDT #CryptoBreakout #AltcoinSeason #DescendingTriangle #TechnicalAnalysis #CryptoTrading #BullishSetup #ReversalPattern #ChartPattern

NEARUSDT 1D AnalysisNEAR ~ 1D Analysis
#NEAR Buy back on retest of this support block with short term target of at least 15%+ from here.

NEARUSDT 1D AnalysisNEAR ~ 1D Analysis
#NEAR Buy again from here if you still have confidence in this coin with a short term target of at least 10%+ and a long term target of $8

NEARUSDT📊 1H Analysis – NEARUSDT
Strategy: 🐊 Alligator Strategy
Trend: 📈 Strong Uptrend
📝 Trade Plan
🎯 Entry Point (EP): 2.835
🛡️ Stop Loss (SL): 2.713
💰 Take Profit 1 (TP1): 2.962
Risk Reward 1:1

NEAR NEAR NEAR Hello friends
Considering the good growth we had, you can see that the price has corrected after reaching its ceiling.
Now, with the price correction, there is a good opportunity to buy in stages and with capital management and move towards the specified goals.
*Trade safely with us*

NEAR Protocol price analysisIt's really hard for CRYPTOCAP:NEAR to grow now....
If we look at the wave analysis, we can assume that the OKX:NEARUSDT price could drop to $2.30-2.50 once again.
And from there, with renewed vigor, it will start upwards to break out of the protracted falling channel above $4.50
_____________________
Did you like our analysis? Leave a comment, like, and follow to get more

NEARUSDT Retest in Play After Breakout — Bulls May Take Charge!BINANCE:NEARUSDT has turned the tide after a prolonged downtrend, now forming higher highs and signaling a shift in momentum. Recently, it broke through a key resistance level, flipping it into support, a classic breakout-retest setup. Right now, price action is retesting that breakout zone, and if it holds, we could see a strong bounce and continuation of the bullish structure. This level is crucial, and a successful retest could pave the way for another leg up.
As always, don’t forget to manage your risk. keep a well placed stop loss in case the market flips unexpectedly.
BINANCE:NEARUSDT Currently trading at $2.8
Buy level : Above $2.75
Stop loss : Below $2.2
Target : $5.5
Max leverage 3x
Always keep stop loss
Follow Our Tradingview Account for More Technical Analysis Updates, | Like, Share and Comment Your thoughts

#NEAR/USDT#NEAR
The price is moving within a descending channel on the 1-hour frame, adhering well to it, and is heading for a strong breakout and retest.
We are experiencing a rebound from the lower boundary of the descending channel, which is support at 2.90.
We are experiencing a downtrend on the RSI indicator, which is about to break and retest, supporting the upward trend.
We are looking for stability above the 100 Moving Average.
Entry price: 2.94
First target: 3.03
Second target: 3.14
Third target: 3.30

NEAR Breakdown Confirmed! More Blood Before the Reversal?Yello, Paradisers! Is #NEAR about to drop even lower, or is a major reversal brewing? Let’s break it down!
💎#NEARUSDT recently suffered a descending triangle breakdown, sending prices tumbling lower. Adding to the bearish pressure, we’ve also got a death cross formation, reinforcing the weakness in price action. Right now, before NEAR can find any long-term bottom, the probability of further downside remains high.
💎The bulls are currently struggling. Multiple resistance levels are blocking any attempts to gain momentum, with all EMAs currently sloping downward—not a good sign for any immediate recovery.
💎NEAR is expected to slowly bleed into the long lower wick of February 3rd. Strong support exists between $2.65 and $2.40, a key demand zone that could trigger a bullish reversal. But if sellers continue to dominate, they could overpower this level and drive prices down further toward $2.05 - $1.95. This is a major higher time frame support zone, where a long-term reversal could finally take shape.
💎For the bulls to negate this growing pressure, they must break above $4.50—a critical level reinforced by both horizontal and descending resistance. If the price secures a bullish breakout above this, NEAR could be in a prime position to rally over the next few months.
Paradisers, as always, patience and precision are key in this market. This isn’t a time for reckless trades—let the levels guide you, trade strategically, and stay disciplined.
MyCryptoParadise
iFeel the success🌴

DeGRAM | NEARUSD is claiming its ETF📊 Technical Analysis
● NEAR returned to the distribution area and pierced the nine‑month descending channel.
● Price is testing the lower boundary of the zone; a 4 h close over that level should carry the token toward the $3 and—if momentum persists—the $5.0 supply. A slide beneath $1.80 voids the setup.
💡 Fundamental Analysis
● The upcoming Chain‑Abstraction upgrade and $20 M Horizon accelerator are drawing builders back to NEAR; GitHub activity is up 27 % MoM.
● Alibaba Cloud’s May partnership brings scalable RPC and staking services, expanding institutional access.
● Bitwise throws spot NEAR ETF in race for SEC approval.
✨ Summary
Breakout plus fresh ecosystem funding and infrastructure support a short‑term long bias: targets $3 → $5; invalidate below $1.8.
-------------------
Share your opinion in the comments and support the idea with a like. Thanks for your support!

#Near Ready For a Major Breakdown? Let's Breakdown Key Levels Yello Paradisers! Is #NEAR about to trap thousands of traders chasing this last move up, only to reverse and flush hard? Let’s take a closer look at the #NearProtocol setup:
💎#NEARUSD is trading at $2.585, slowly grinding higher within a clearly defined Ending Diagonal structure. This textbook formation often tricks even experienced traders into entering too early. The current wave count suggests we’re in the final leg, Wave 5 is still in play, but it’s unfolding suspiciously close to a heavy resistance zone, one that previously acted as strong resistance and rejected it.
💎This zone, sitting around the $2.80–$2.90 area, is the key pivot for this entire setup. The bearish structure would be invalidated if #NEAR manages to break and close above this resistance with conviction, especially backed by strong volume. That kind of breakout would suggest the market still has bullish momentum and could drive the price toward the $3.00 region or higher. However, without a convincing breakout, the odds are still skewed to the downside.
💎As long as the price remains under this critical resistance zone, the Ending Diagonal pattern remains valid, and history has shown how brutal the reversal from this structure can be. A failure to break out cleanly is likely to lead to a sharp and rapid decline. The first area of interest on the way down would be the $2.153 level, an important support that the price has reacted to in the past.
💎Should this level break, the door opens to a deeper correction targeting $1.819, where the Volume Profile begins to rise again and buyers have previously stepped in. Momentum indicators are also not aligning with the bullish case. The RSI is showing clear signs of weakening strength, failing to keep up with the price as the move extends into the final wave.
Play it safe, respect the structure, and let the market come to you!
MyCryptoParadise
iFeel the success🌴

NEARUSDT 1D AnalysisNEAR ~ 1D Analysis
#NEAR Buy after successfully penetrating this resistant line with a short -term target of at least 10%+ from here.

NEAR/USDT 1H Chart: Breakout or Breakdown?Hey crypto traders! Let’s zoom into this 1-hour chart, because NEAR is serving up some serious action!
We’ve got a massive triangle forming, with the price squeezing tighter and tighter between converging trendlines. NEAR is currently dancing around $2.466, teasing a breakout after bouncing between resistance at $2.729 and support at $2.419. This pattern is a pressure cooker, and a big move is coming — will it soar to new highs or crash back down?
A bullish breakout above the upper trendline could propel NEAR past $2.610, potentially targeting $2.729 or higher! But if it fails to hold support at $2.540, we might see a dip toward $2.419 or even lower.
Key Levels to Watch:
Resistance: $2.610
Support: $2.540
Breakout Target: $2.729+
Breakdown Risk : $2.419
What’s your take — bullish surge or bearish pullback? Let’s hear your predictions below!

Short Term NEAR (4H)Near has formed a reversed head and shoulders pattern while breaking up a downwards trendline. Also retest confirmed. As long as the level of 2$ is maintained, Near should go upwards through 2.4$ at least.
Use 1.78 as stoploss and enter long right here.
Thanks for reading.

NEARUSDT 1WNEAR ~ 1W Analysis
#NEAR Buy gradually from here if you still have a Conviction on this coin with a short -term target of at least 20%+.

NEARUSD Huge bullish divergence targeting $7.000NEAR Protocol / NEARUSD is trading inside a 1 year Channel Down.
The price is lately inside a smaller Channel Down that failed today and got rejected on the 1day MA50.
The 1day RSI howver has been on a Channel Up in the meantime, which is a huge bullish divergence and resembles the mid September 2024 rejection.
That was on the larger scale though a bottom for the Channel Down that initated a big rally to its top.
Buy and target $7.000.
Follow us, like the idea and leave a comment below!!
