#NEAR is positioning itself for a W pattern to ~ $10Early stages of the W being formed.
But this gives us a clear level which negates this idea... the most recent local lows.
Currently long NEAR on spot and low leverage futures.
I like what i'm seeing on the development of this ecosystem , and believe it will thrive in the next cycle.
NEARUSD

NEARUSD ❕ uptrendThere is still a downward compression on the chart.
NEAR has formed an upward channel.
Price and RSI have formed a bullish divergence (4H TF)
I expect growth if the asset holds in the channel, further movement will depend on the price reaction to the downtrend line.

NEARUSD ❕ trend compressionThere is a decline in trading volume on the NEAR price decline.
The asset is testing 50EMA as support (1H TF).
I expect a bounce in case NEAR is able to fix itself above the liquidity zone.

NEAR Protocol (NEAR) - October 17Hello?
Welcome, traders.
By "following", you can always get new information quickly.
Please also click "Boost".
Have a good day.
-------------------------------------
(NEARUSDT 1W Chart)
The key is whether the 2.792-3.545 zone is supported and able to rise.
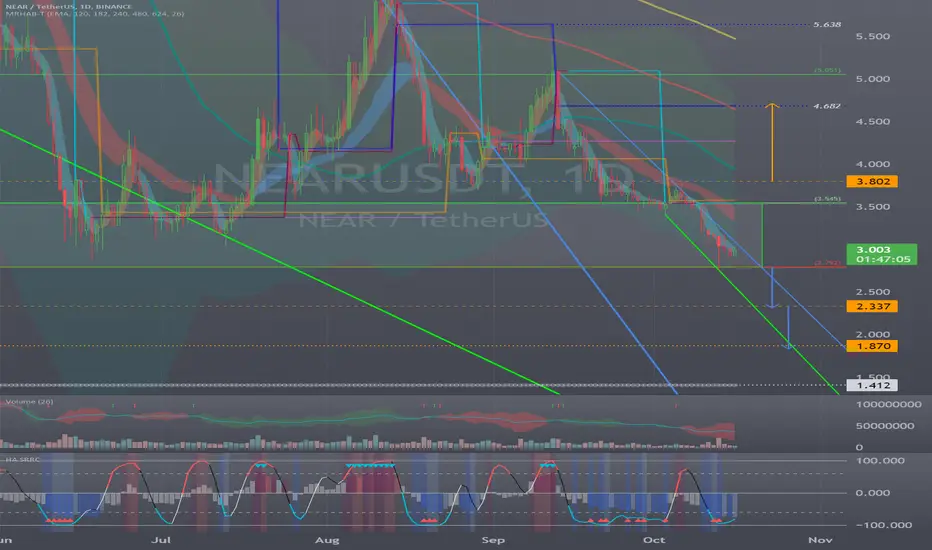
(1D chart)
If it falls below 2.792, we should see support near 2.337.
If it rises above the 3.545-3.802 section, it is expected to rise to around 4.682.
------------------------------------------------------------ -----------------------------------------------------
** All descriptions are for reference only and do not guarantee a profit or loss in investment.
** If you share this chart, you can use the indicators normally.
** The MRHAB-T indicator contains indicators that indicate support and resistance points.
** SR_R_C indicators are displayed as StochRSI(line), RSI(columns), CCI(bgcolor).
** CCI indicator is expressed as overbought range (CCI > +100) and oversold range (CCI < -100).
(Short-term Stop Loss can be said to be a point where profit and loss can be preserved or additional entry can be made through split trading. It is a short-term investment perspective.)
---------------------------------
✅TS ❕ NEARUSD: support level✅✅ NEAR has reached the support level.
The price has already formed a double top.
Growth is possible.✅
🚀 BUY scenario: long to the resistance area.🚀
----------------------------------------------------------------------------
Remember, there is no place for luck in trading - only strategy!
Thanks for the likes and comments.

NEARUSD ❕ oversoldOversold harder than many coins.
TD Sequential has formed an upside reversal signal (1H TF).
I expect growth while holding the support.

NEAR - received support from Google Cloud.The lack of demand on the chart is displayed by a false breach of the upper boundary of the trading range.
Also it is visible a weak buyer who could not accelerate the price to the local highs.
If the price does not hold in the area of the buyer's interest and we do not see the resumption of purchases, then we will go to higher profitable prices.
If you liked the idea, please like it. That's the best "Thank you!" for the author 😊
P.S. Always do your own analysis before a trade. Put a stop loss. Fix profits in installments. Withdraw profits in fiat and make yourself and your loved ones happy.

NEAR Protocol (NEAR) - October 7Hello?
Welcome, traders.
By "following", you can always get new information quickly.
Please also click "Boost".
Have a good day.
-------------------------------------
(NEARUSDT 1W Chart)
The key is whether the 2.792-3.545 zone is supported and able to rise.
(1D chart)
The 2.792-3.545 interval is the interval that determines the trend.
So, if the price holds at or above the 2.792-3.545 range, it is expected to rise.
In order to turn into an uptrend, it must rise above the HA-Low indicator.
Therefore, it should rise above 4.063.
In order to continue the upward trend, it must rise above the HA-High indicator.
So, we need to see if we can sustain the price by moving towards the 4.682-5.638 range.
In the SR_R_C indicator, the Stoch RSI and CCI indicators are entering the overbought zone, so it is necessary to check whether the 2.792-3.545 zone is supported when it breaks out of the overbought zone.
------------------------------------------------------------ -----------------------------------------------------
** All descriptions are for reference only and do not guarantee a profit or loss in investment.
** If you share this chart, you can use the indicators normally.
** The MRHAB-T indicator contains indicators that indicate support and resistance points.
** SR_R_C indicators are displayed as StochRSI(line), RSI(columns), CCI(bgcolor).
** CCI indicator is expressed as overbought range (CCI > +100) and oversold range (CCI < -100).
(Short-term Stop Loss can be said to be a point where profit and loss can be preserved or additional entry can be made through split trading. It is a short-term investment perspective.)
---------------------------------

NEARUSD ❕ scenario continuesRSI entered bullish zone (4H TF)
Price has formed a reversal signal down TD Sequential (1H TF)
I expect growth according to the scenario after fixing above the current level.

✅TS ❕ NEARUSD: bounced off✅✅ NEAR bounced off the support level.
Now the price may make a small correction to form a second bottom.
Expectations bounce up.✅
🚀 BUY scenario: long until 4.108.🚀
----------------------------------------------------------------------------
Remember, there is no place for luck in trading - only strategy!
Thanks for the likes and comments.

NEARUSD ❕ descending wedgeNEAR trades at a strong support level.
Trading volatility has declined and so has trading volume.
On the 4H Timeframe, price and RSI have formed a bullish divergence.
I expect growth after fixing above resistance.

✅TS ❕ NEARUSD: fell heavily✅✅NEAR broke through the levels and fell heavily.
Now the price has reached the support level.
An upward rebound is possible.✅
🚀 BUY scenario: long to 4.1.🚀
----------------------------------------------------------------------------
Remember, there is no place for luck in trading - only strategy!
Thanks for the likes and comments.


NEARUSD ❕ pivot pointPrice and RSI have formed a bullish divergence (4H TF)
TD Sequential formed an upward reversal signal (1H TF)
I think NEAR may start to bounce when price holds above support.

NEAR Protocol (NEAR) - September 28Hello?
Welcome, traders.
By "following", you can always get new information quickly.
Please also click "Like".
Have a good day.
-------------------------------------
(NEARUSDT 1W Chart)
The key is whether the 2.792-3.545 zone is supported and able to rise.
(1D chart)
In order to continue the upward trend, it must rise above the HA-High indicator.
So, the key is whether it can move higher than 4.682.
However, it is expected to show a sharp rise only when it rises above 5.638.
If not, you should check to see if it is supported in the 2.792-3.545 section.
If it falls below 2.792, it is likely to move towards the 1.412 area.
------------------------------------------------------------ -----------------------------------------------------
** All descriptions are for reference only and do not guarantee a profit or loss in investment.
** If you share this chart, you can use the indicators normally.
** The MRHAB-T indicator contains indicators that indicate support and resistance points.
** Background color of Long/Short-S indicator: RSI oversold and overbought sections
** SR_R_C indicators are displayed as StochRSI(line), RSI(columns), CCI(bgcolor).
** CCI indicator is expressed as overbought range (CCI > +100) and oversold range (CCI < -100).
(Short-term Stop Loss can be said to be a point where profit and loss can be preserved or additional entry can be made through split trading. It is a short-term investment perspective.)
---------------------------------

NEARUSD ❕ continuing scenarioNEAR declined as I described in the last idea.
Trading volumes are showing interest in the drop in price.
I believe that the price can continue to decline if it fixes under support.

✅TS ❕ NEARUSD: moving down✅✅NEAR is moving in a downtrend. The price is updated minimums. Now there is a correction, after which the price will go down.✅
🚀 SELL scenario: short below the support level.🚀
----------------------------------------------------------------------------
Remember, there is no place for luck in trading - only strategy!
Thanks for the likes and comments.

NEARUSDT ANALYSIS , 1 DAYI want to share my opinion with you
In the past, whenever we experienced an uptrend, we saw strong declines after the uptrend support was broken
I think that if the uptrend level is broken, we will see the price decrease until the price of 1.95 dollars

NEARUSD ❕ a bounce before the fallTrading volumes show no interest in price growth.
NEAR has just entered the oversold RSI zone (4H TF)
I believe that the downward movement will continue after fixing under the resistance level.

NEAR Protocol (NEAR) - September 19Hello?
Welcome, traders.
By "following", you can always get new information quickly.
Please also click "Like".
Have a good day.
-------------------------------------
(NEARUSDT 1W Chart)
The key is whether you can keep the price above 3.545.
(1D chart)
In order to turn into an uptrend, it should find support and move higher near 4.063.
It needs to move above 4.682 to continue the uptrend.
However, there is a possibility of resistance in the 5.051-5.638 section.
If it goes down, you should check to see if it finds support at the 2.792-3.545 level.
A full-fledged uptrend is expected to begin when it rises above 8.556.
------------------------------------------------------------ -----------------------------------------------------
** All descriptions are for reference only and do not guarantee a profit or loss in investment.
** The MRHAB-T indicator, which is inactive on the chart, contains indicators that indicate support and resistance points.
** Background color of Long/Short-S indicator: RSI oversold and overbought sections
** Background color of CCI-C indicator: When the short-term CCI line is below -100 and above +100, oversold and overbought sections are displayed.
** The OBV indicator was re-created by applying a formula to the DepthHouse Trading indicator, an indicator disclosed by oh92. (Thanks for this.)
(Short-term Stop Loss can be said to be a point where profit and loss can be preserved or additional entry can be made through split trading. It is a short-term investment perspective.)
---------------------------------

✅TS ❕ NEARUSD: bounced off✅✅NEAR broke the uptrend. The price has updated the lows. Correction is now possible. After that, you can expect a fall.✅
🚀 SELL scenario: short to 3.8.🚀
----------------------------------------------------------------------------
Remember, there is no place for luck in trading - only strategy!
Thanks for the likes and comments.

✅TS ❕ NEARUSD: reached the support✅✅NEAR has already formed the fourth peak in the area of the resistance level. The price dropped every time after touching the level. I expect a second bounce down.✅
🚀 SELL scenario: short to 3.84.🚀
----------------------------------------------------------------------------
Remember, there is no place for luck in trading - only strategy!
Thanks for the likes and comments.

📚Learn More💰Earn More - Inverse Head and Shoulders in NEARUSD📚 LEARN MORE
💰 EARN MORE
Inverse Head and Shoulders Definition:
A head and shoulders pattern is also a trend reversal formation.
It is formed by a Valley (left shoulder), followed by a Lower Valley (head), and then another Higher Valley (right shoulder).
A “Neckline” is drawn by connecting the highest points of the two Peaks. Neckline resistance does not need to be strictly horizontal.
This illustrates that the downward trend is coming to an end.
When a Head and Shoulders formation is seen in a downtrend, it signifies a major reversal.
The pattern is confirmed once the price breaches the neckline resistance.
In this example, we can easily see the head and shoulders pattern.
How to Trade the Head and Shoulders Pattern:
ENTRY :
we put an entry order above the neckline.
TARGET :
We can also calculate a target by measuring the lowest point of the head to the neckline.
This distance is approximately how far the price will move after it breaks the neckline.
❤️ If you find this helpful and want more FREE forecasts in TradingView
. . . . . Please show your support back,
. . . . . . . . Hit the 👍 LIKE button,
. . . . . . . . . . Drop some feedback below in the comment!
❤️ Your Support is very much 🙏 appreciated!❤️
💎 Want us to help you become a better Forex trader?
Now, It's your turn!
Be sure to leave a comment let us know how you see this opportunity and forecast.
Trade well, ❤️
ForecastCity English Support Team ❤️
